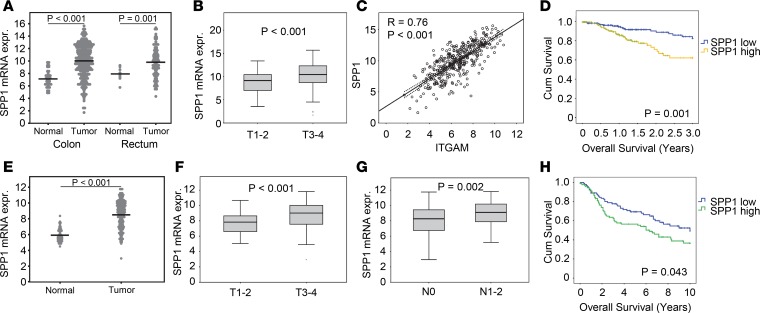
Figure 6. SPP1 correlates with tumor size and poor survival in human colorectal cancer patients.
(A) SPP1 mRNA expression of colon primary tumor (n = 286) compared with normal colon tissue (n = 41) and rectum primary tumor (n = 9) compared with normal rectum tissue (n = 94) of the TCGA data. Lines represent the means. (B) Box blots comparing SPP1 mRNA expression in colorectal primary tumor samples of low (T1-2, n = 69) and high (T3-4, n = 300) T stage. (C) Scatter plot showing correlations between SPP1 and ITGAM (n = 380). Regression lines with corresponding 95% CI are presented within each graph. (D) Kaplan-Meier analysis of colorectal primary tumor samples distributed into low (n = 181) and high (n = 180) SPP1 expression. (E) SPP1 mRNA expression of colon primary tumor (n = 186) compared with normal colon tissue (n = 54) of the GSE41258 data. Lines represent the means. (F and G) Box plots comparing SPP1 mRNA expression in colorectal primary tumor samples of low (T1-2, n = 38) and high (T3-4, n = 144) T stage (F) and negative (N0, n = 93) and positive (N1-2, n = 89) N stage (G). (H) Kaplan-Meier analysis of colorectal primary tumor samples distributed into low (n = 91) and high (n = 91) SPP1 expression. Data are displayed as log2 mRNA expression intensity. Unpaired 2-tailed t test was used to calculate P values. To determine P values for the Kaplan-Meier analysis, we performed log-rank test.

