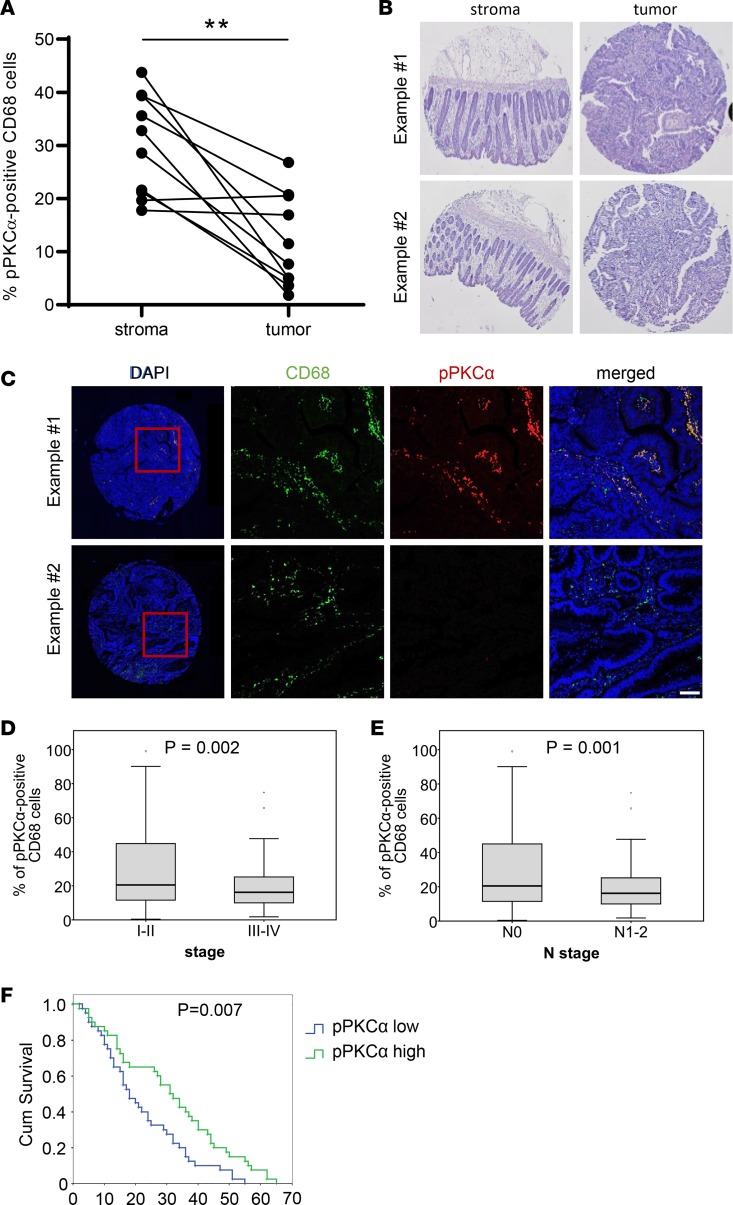
Figure 7. mTORC2 activity correlates with tumor stage and survival in human colorectal cancer patients.
(A) Percentage of pPKCα+CD68+ macrophages in tumor and associated stroma of the corresponding patient. (B) Representative H&E staining of stroma and tumor samples from A. Magnification, 2×. (C) Tumor samples from B showing high (upper panel) and low (lower panel) pPKCα (red) staining and CD68+ macrophages (green). Scale bar: 50 µm. (D and E) Box plots comparing pPKCα+CD68+ macrophages in colorectal primary tumor samples of low (I–II, n = 63) and high (III–IV, n = 117) stage (D) and negative (N0, n = 111) and positive (N1-2, n = 69) N stage (E). (F) Kaplan-Meier analysis of colorectal primary tumor samples distributed into low (n = 83) and high (n = 83) pPKCα expression. Unpaired 2-tailed t test was used to calculate P values. To determine P values for the Kaplan-Meier analysis, we performed log-rank test.

