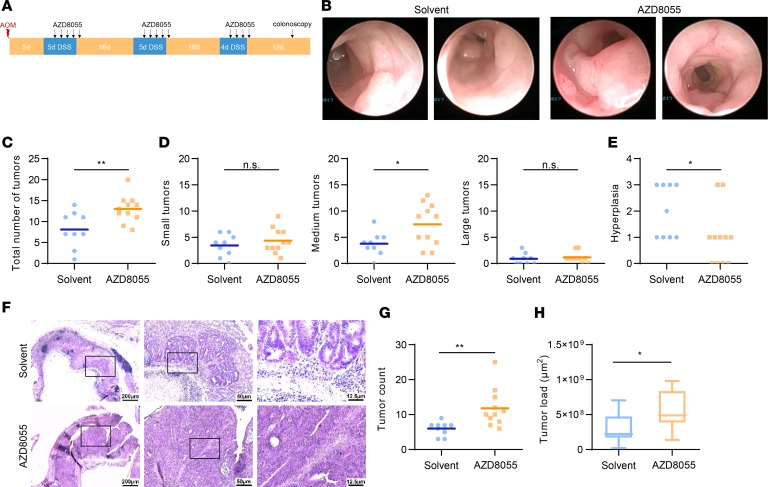
Figure 8. A second-generation mTOR inhibitor exacerbates tumorigenesis in DSS-induced cancer.
(A) Scheme of the AOM/DSS-induced colitis–associated cancer model with the treatment of AZD8055. Day 0 corresponds to the AOM administration. A colonoscopy was performed on day 57. Mice were sacrificed on day 67. (B) Representative pictures of the colonoscopy. (C–E) Total (C) and size-divided (D) tumor count during the colonoscopy, as well as hyperplasia (E). (F) Representative picture of the H&E stainings in 3 different magnifications. From left to right: ×2.5 (scale bar: 200 μm), ×10 (scale bar: 50 μm), ×40 (scale bar: 12.5 μm). (G and H) Tumor count (G) and tumor load (H) analyzed by the H&E stainings. P values were determined by unpaired 2-tailed Student’s t test.

