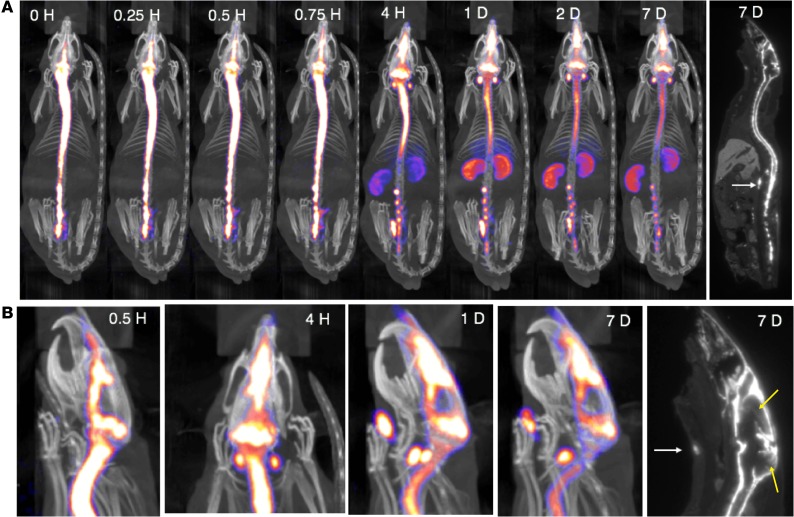
Figure 1. SPECT/CT live imaging of IT-dosed ASO.
125I-Malat1 ASO was given as an IT bolus (~180 μg; 230.7 ± 42.6 μCi) in male Sprague-Dawley Rats (n = 5, 270.8 ± 30.6 g). (A) Representative whole-body SPECT/CT and autoradiogram (far right) performed at indicated times after dosing. (B) Head and neck close-up of SPECT/CT images showing egress to nasal turbinates and lymph nodes (white arrows). Head and neck closeup of autoradiogram (far right) shows parenchymal radioactive signal in cerebral cortex and cerebellum (yellow arrows). This is imaging from 1 representative animal from a group of 4 that were imaged in this experiment.

