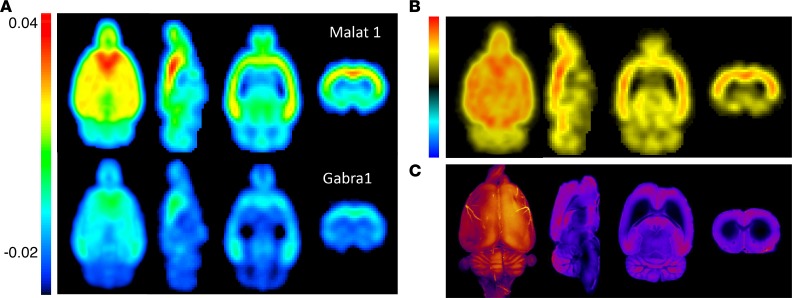
Figure 10. Nuclear and fluorescence imaging maps of ASO PK and PD.
(A) Group-averaged AUC images of 18F-flumazenil PET data from Malat1 ASO– or Gabra1 ASO–treated animals (n = 6 each) at 4 weeks. (B) Map of 18F-flumazenil PET signal difference between Malat1 ASO– and Gabra1 ASO–treated animals at 4 weeks. (C) 3D and 2D CFT images of Gabra1 Cy7-ASO at 8 and 12 hours, respectively.

