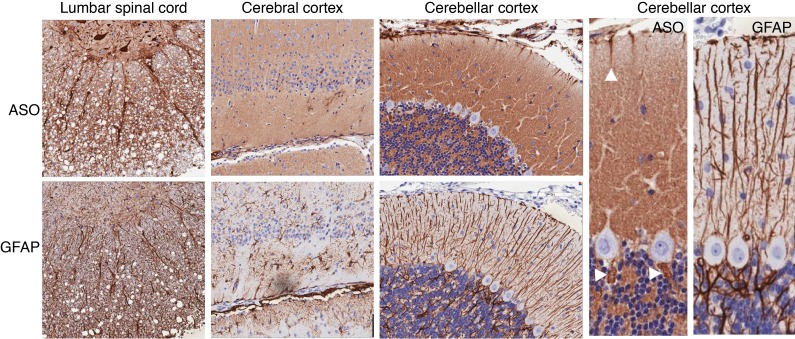
Figure 3. ASO colocalization with axonal and glial structures.
IHC performed for ASO and GFAP at 30 minutes after lumbar IT dosing of anti-GluR1 ASOs. From left to right, staining is shown associated with lumbar spinal cord axonal bundles, axon- and astrocyte-rich sub-pial tissue in cerebral cortex, and the Bergmann glia-rich layers of the cerebellar cortex. Arrowheads show early ASO signal that was observed in what appear to be Bergman glial cell bodies adjacent to Purkinje cells, as stained by GFAP IHC in adjacent sections Images in the left 3 columns are at ×20 magnification and the right 2 images have additional ×2 digital magnification.

