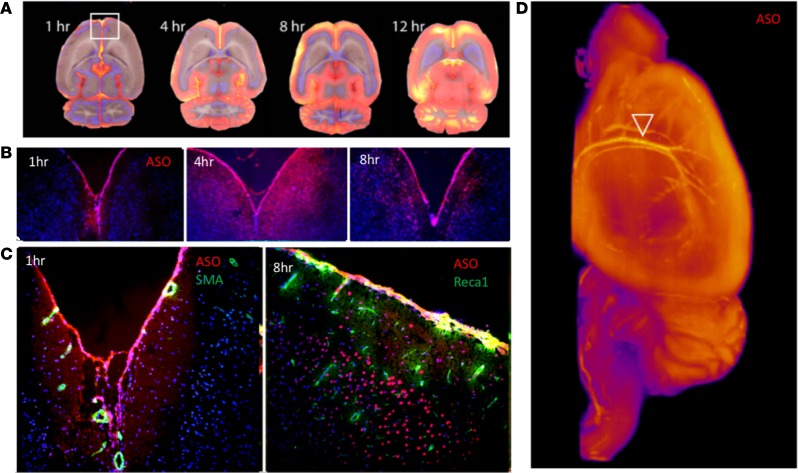
Figure 5. Cryofluorescence tomography (CFT) of ASO permeation into brain tissue.
(A) Cy7-labeled Gabra1 ASOs (700 μg) were dosed IT, brains removed for CFT at various times after dosing, and photographed under white and fluorescent light after each 25-μm block-face section. (B) Trans-pia movement of Gabra1 Cy7-ASOs (×10 magnification). (C) Vascular association and cell uptake of Gabra1 Cy7-ASOs (×20 magnification). (D) Peri-arterial association of Cy7-ASO in 3D reconstruction of CFT data. Arrowhead points to basilar and middle cerebral arteries. Deeper vessels seen include the interhemispheric anterior cerebral artery.

