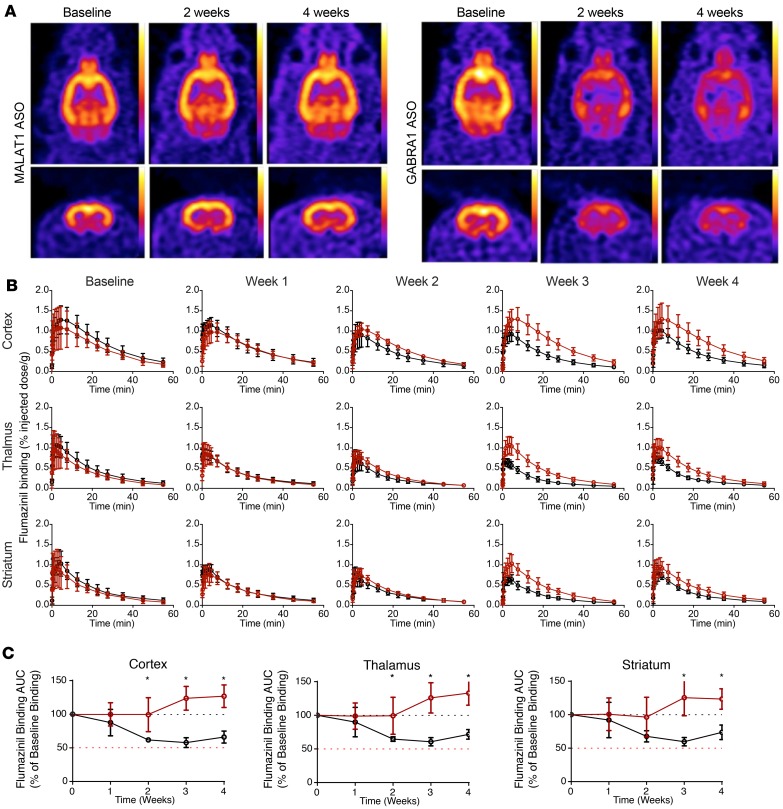
Figure 9. Live pharmacodynamic PET imaging of Gabra1 ASO–mediated receptor knockdown.
(A) 18F-flumazenil brain uptake in representative Malat1 ASO– or Gabra1 ASO–treated animals. Horizontal and coronal images. (B) 18F-flumazenil tissue concentration curves in Malat1 ASO (black) or Gabra1 ASO (red) groups at baseline or various time points after dosing. (C) AUC of 18F-flumazenil tissue concentration curves at each time point expressed as a percentage of baseline AUC for different brain regions. Malat1 ASO group is shown in red and Gabra1 ASO group is shown in black. Data are graphed as mean ± SD, with n values of 4 for each group. Analysis of differences between AUCs between groups and time points was by 2-way ANOVA with Bonferroni’s post hoc test; *P < 0.05.

