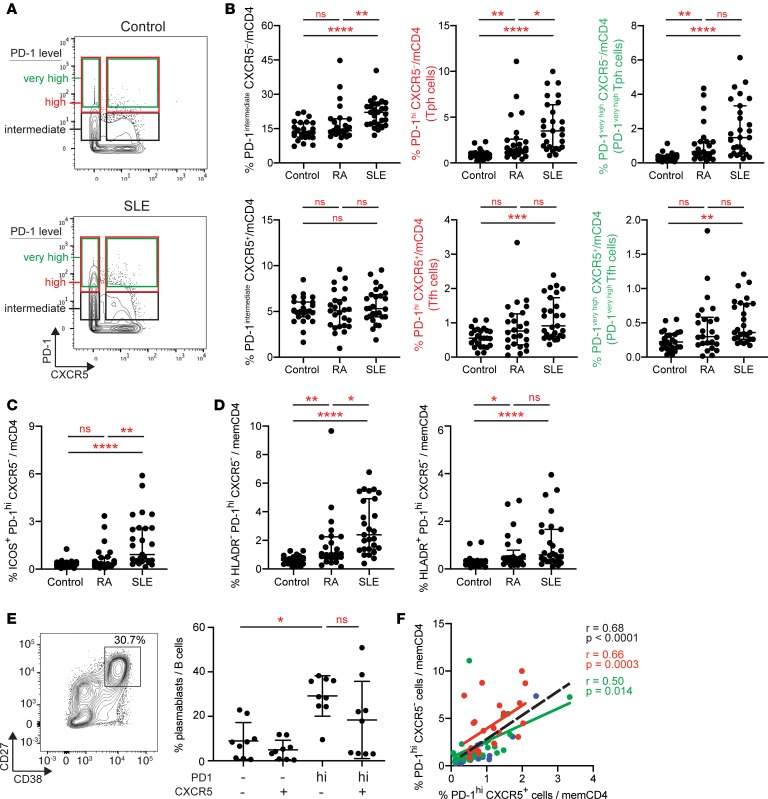
Figure 2. Expanded PD-1hiCXCR5– Tph cells in the blood of SLE patients.
(A) Example of gating of memory CD4+ T cells with different levels of PD-1 expression in AMP mass cytometry data. (B) Quantification of CXCR5– and CXCR5+ memory CD4+ T cell populations with intermediate, high, or very high PD-1 expression as depicted in A in controls (n = 25), RA (n = 25), and SLE (n = 27) patients using AMP mass cytometry data. (C) Quantification of PD-1hiCXCR5–ICOS+ memory CD4+ T cells in AMP mass cytometry data as in B. (D) Quantification of PD-1hiCXCR5– cells that express or do not express HLA-DR as in B. (E) Example flow cytometry detection of plasmablasts in T cell–B cell cocultures and quantification of plasmablasts among B cells in cocultures of memory B cells with indicated CD4+ T cell subsets from SLE patients. Pooled data from 9 donors. Error bars show median ± interquartile range (B, C, D) or mean ± SD (E). *P < 0.05, **P < 0.01, ***P < 0.001, ****P < 0.0001 by Kruskal–Wallis with Dunn’s multiple comparisons test (B–E). (F) Correlation between PD-1hiCXCR5– and PD-1hiCXCR5+ cell frequencies in AMP mass cytometry data (red, SLE patients; green, RA patients; blue, controls; black line, all patients). Spearman correlation statistics shown.

