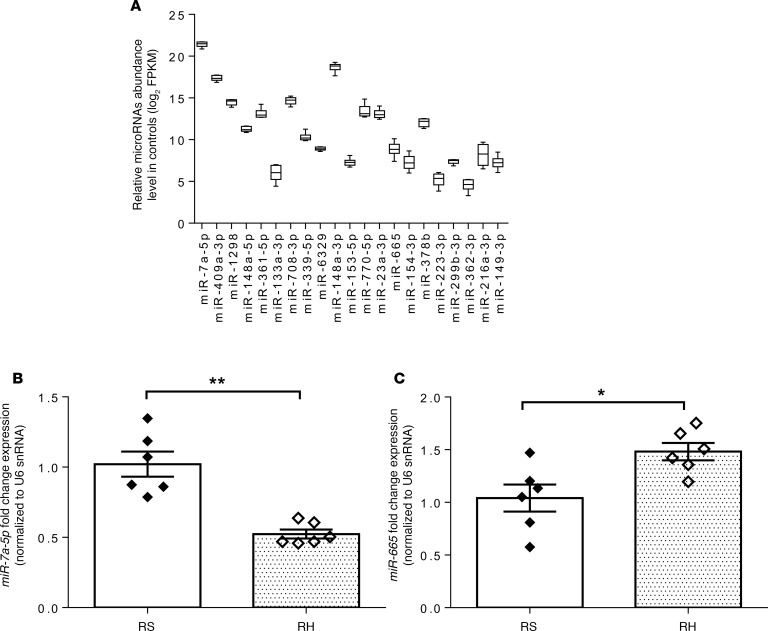
Figure 2. Expression of key microRNAs by quantitative real-time PCR confirms the differential microRNA expression observed by RNA-sequencing.
(A) Abundance level of top differentially expressed microRNAs in the VMH of control rats. (B) MicroRNA-7a-5p and (C) microRNA-665 expression by quantitative real-time PCR (qPCR) in the VMH of control (RS) and RH rats. MicroRNA expression levels are represented as relative fold change expression after normalization with reference to the expression of U6 small nuclear RNA (U6 snRNA) endogenous control. Data are expressed as mean ± SEM (n = 6/group). *P < 0.05, and **P < 0.01 vs. RS group; unpaired 2-tailed Student’s t test. MicroRNA abundance levels are expressed as log2 of FPKM. FPKM, fragments per kilobase of transcript per million reads mapped to microRNAs.

