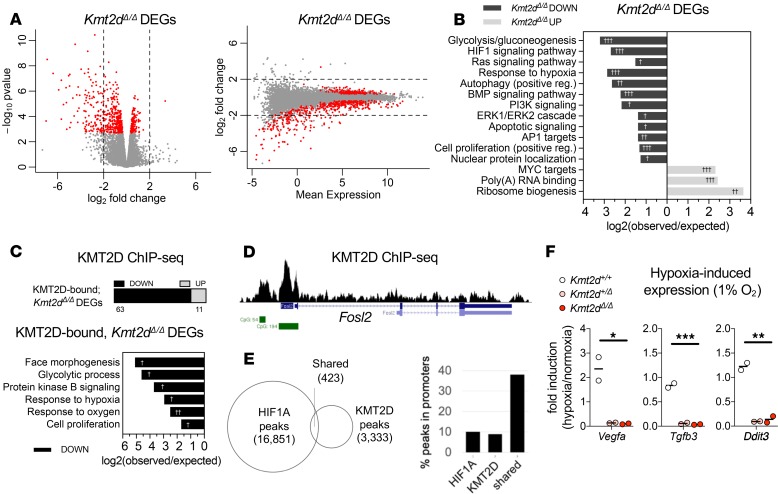
Figure 2. Suppressed transcription of KMT2D-regulated hypoxia response genes upon loss of the Kmt2d SET methyltransferase domain in neuronal cells.
(A) Expression analysis by RNA-Seq in HT22 cells revealed 575 significant differentially expressed genes (DEGs) in Kmt2dΔ/Δ clones (3 biological replicates) relative to Kmt2d+/+ cells, each in technical triplicate. Fold changes in expression indicate the most significant Kmt2dΔ/Δ DEGs (~76%, red dots) are downregulated in Kmt2dΔ/Δ cells, plotted against P value and mean expression. (B) Gene networks significantly enriched among down- or upregulated Kmt2dΔ/Δ DEGs. (C) Kmt2dΔ/Δ DEGs that are also KMT2D bound, as determined by ChIP-Seq chromatin profiling in Kmt2d+/+ HT22 cells, and gene networks significantly enriched among KMT2D-bound, Kmt2dΔ/Δ DEGs. (D) Representative ChIP-Seq track of a KMT2D-bound, Kmt2dΔ/Δ DEG depicting KMT2D binding peaks (shown in black), RefSeq gene annotations (shown in blue), and CpG islands (shown in green). (E) Overlapping loci of observed KMT2D-ChIP peaks in HT22 cells and HIF1A-ChIP peaks in embryonic hearts (26). Overlapping KMT2D/HIF1A peak regions, compared with individually bound regions, are enriched at gene promoters. (F) Reverse transcription quantitative PCR (RT-qPCR) analysis of hypoxia-induced gene expression in Kmt2d+/+, Kmt2d+/Δ, and Kmt2dΔ/Δ cells, following 72 hours in normoxia (21% O2) or hypoxia (1% O2), with fold induction of target gene mRNA. Two biological replicates per genotype, each in technical triplicate. One-way ANOVA (*P < 0.05, **P < 0.01, and ***P < 0.001). Fisher’s exact test (†FDR < 0.05, ††FDR < 0.01, and †††FDR < 0.001).

