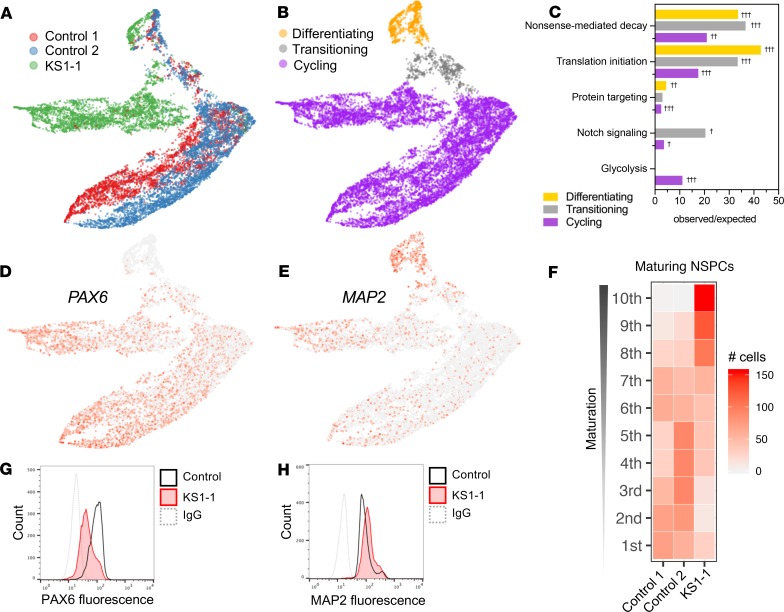
Figure 4. Transcriptional suppression of metabolic genes in cycling cells and precocious neuronal differentiation in KS1 patient–derived NSPCs.
(A) scRNA-Seq profiling in patient and healthy control iPSC-derived NSPCs (~5000 cells per patient), with Uniform Manifold Approximation Projection (UMAP) to visualize gene expression differences between cells. (B) NSPCs partitioned by maturation stage as defined by stage-specific marker expression and (C) enriched gene networks, analyzed exclusively among DEGs for each NSPC subset (cycling, transitioning, and differentiating). (D and E) Representative UMAPs annotated by relative expression intensities of NSPC markers, revealing the maturation trajectory from early NSPCs (PAX6+) to differentiating NSPCs (MAP2+). (F) Heatmap comparing density of NSPCs along the maturation trajectory, defined by binned marker expression from earliest (first) to most differentiated (10th) deciles, with KS1 cells disproportionately occupying the most mature bins. (G and H) Protein-level experimental validation of marker expression differences by flow cytometry in NSPCs from KS1 patient and controls, plotting fluorescence intensities of PAX6 and MAP2. Fisher’s exact test (†FDR < 0.05, ††FDR < 0.01, and †††FDR < 0.001).

