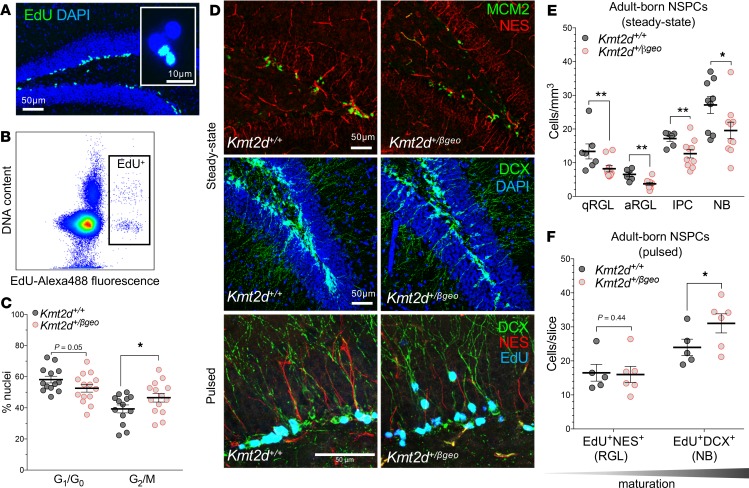
Figure 5. In vivo defects of neurogenesis and NSPC differentiation in a Kmt2d+/βgeo mouse model of KS1.
(A) Immunostaining images of dividing (EdU-pulsed) dentate gyrus (DG) NSPCs and nuclei purified from microdissected DG by fluorescence-activated cell sorting (FACS) (B) of labeled nuclei. (C) Cell cycle analysis in purified EdU+ DG nuclei from Kmt2d+/+ and Kmt2d+/βgeo mice sampled 16 hours after pulse, using DAPI fluorescence (13–14 mice per genotype, 200–500 nuclei per mouse). (D) Representative confocal immunostaining of neurogenesis markers in the DG of adult Kmt2d+/+ and Kmt2d+/βgeo mice at steady state (6–10 mice per genotype, 7–10 Z-stack images per mouse) or after EdU pulse (5–6 mice per genotype, 10 Z-stack images per mouse). NES+ radial glia-like (RGL) NSPCs, in either quiescent (minichromosome maintenance complex component 2–negative, MCM2–) or activated (MCM2+) states (qRGL and aRGL, respectively), MCM2+ NES946 intermediate progenitor cells (IPCs), and DCX+ neuroblasts (NBs) were quantified. (E and F) Quantification of stage-specific NSPC densities (qRGL, aRGL, IPC, and NB) in adult Kmt2d+/+ and Kmt2dβ/geo mice at steady state (E) or after EdU pulse-chase (2 weeks) to birth date, differentiating NSPCs (F). Bars indicate mean ± SEM. One-tailed Student’s t test (*P < 0.05, **P < 0.01, and ***P < 0.001). Scale bars: 50 μm, unless otherwise specified (A, inset, 10 μm).

