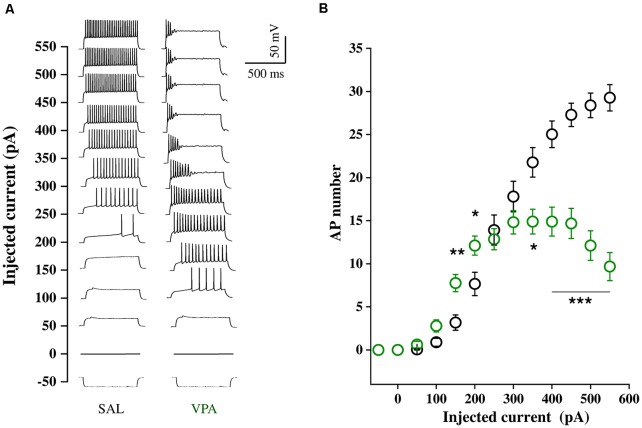
Figure 5.
Intrinsic excitability of SAL MSNs and VPA MSNs. (A) Representative voltage traces obtained in response to–50 to 550 pA current steps (800 ms duration, 50 pA amplitude) from resting potential, recorded from SAL and VPA MSNs. (B) Number of APs fired plotted against current steps of increasing value (SAL MSNs, n = 35; VPA MSNs, n = 37). Data represent mean values ± SEM; *p < 0.05, **p < 0.01, ***p < 0.001 vs. SAL group (Student’s t-test).

