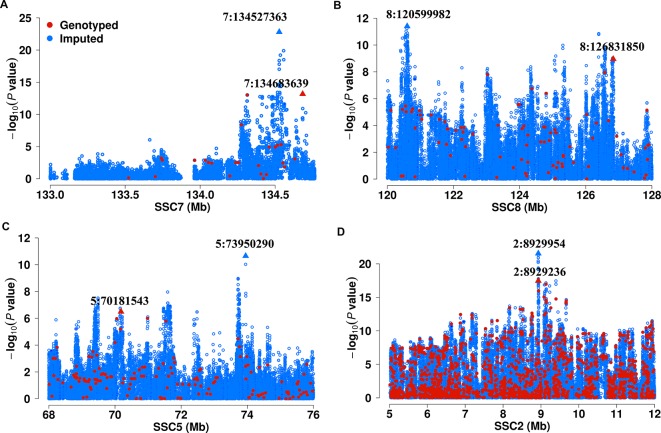
Figure 1.
Comparison of association strength between imputed and chip SNPs. (A) region for C20:1n-9 on SSC7 in F2 population; (B) region for C18:1n-9/C16:1n-7 on SSC8 in F2 population. (C) region for C20:0/C18:0 on SSC5 in Sutai population. (D) region for C20:3n-6/C18:2n-6 on SSC2 in Erhualian population. Imputed and chip SNPs were denoted in blue and red color, respectively. The lead SNPs are marked by triangles.

