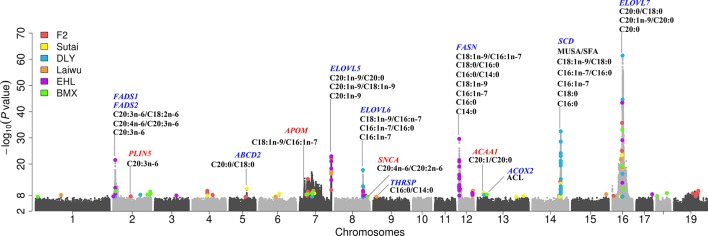
Figure 2.
A combined Manhattan plot for GWAS on fatty acid composition traits across six populations. Genome-wide representation of all lead SNPs identified single population GWAS, which were marked by a colored dot. Results from different populations were represented by different colors. The y axis shows the -log10p-values for association with corresponding fatty acid composition traits and the x axis shows the genomic position of genetic variants. Candidate genes are denoted with different colors, blue for candidate gene previously identified, and red for candidate gene newly found in current study.

