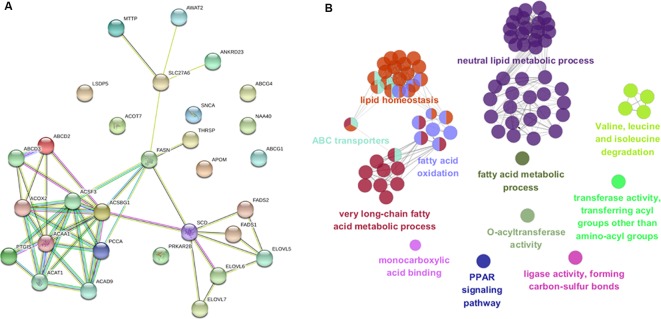
Figure 6.
Protein-protein interaction network and gene ontology enrichment analysis of candidate genes. (A) Protein-protein interaction network of the 32 most plausible candidate genes of the lead SNPs detected by GWAS and meta-analysis in STRING v10.5 database. (B) Gene ontology enrichment analysis of candidate genes. Over-represented GO/pathway terms were grouped based on kappa statistics. GO/pathway terms are represented as nodes, and the node size represents the term enrichment significance, while the edges represent significant similarity between categories.

