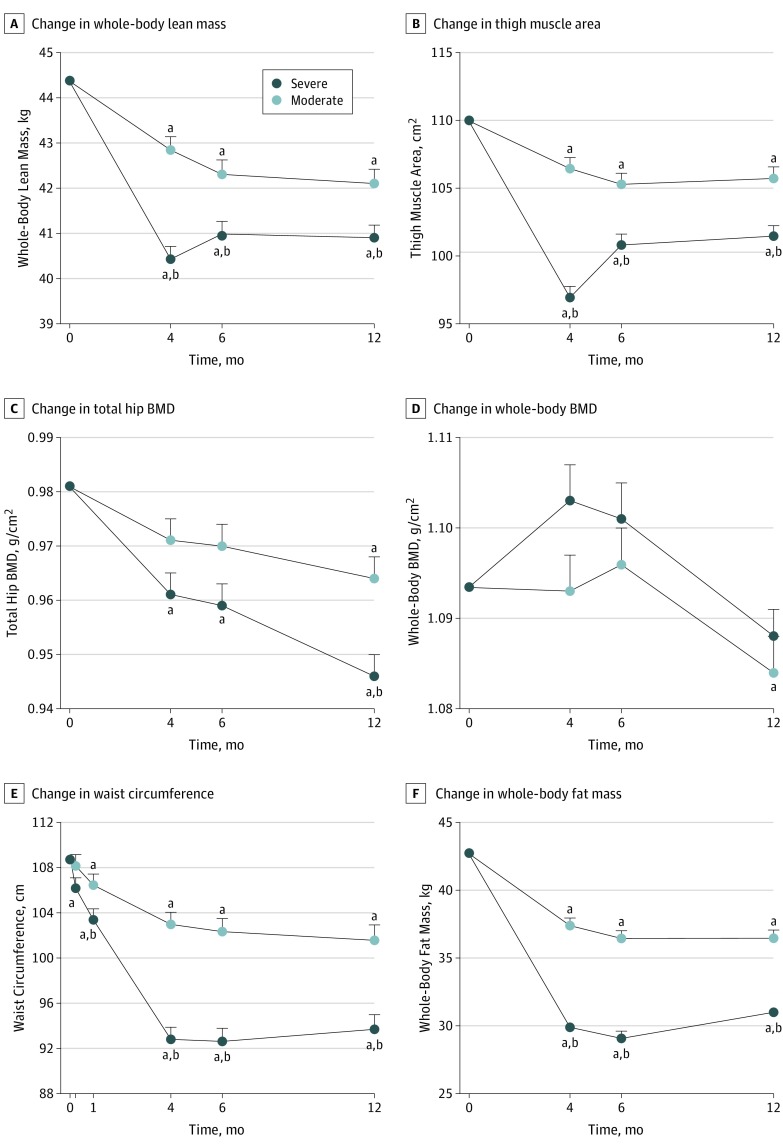
Figure 3. Effect of Severe vs Moderate Energy Restriction on Body Composition in Postmenopausal Women With Obesity .
Data are presented as estimated marginal means (ie, group means after controlling for covariates). Baseline values were the covariates in the statistical analysis model. Whiskers indicate SEs of the means. BMD indicates bone mineral density.
aP < .05 vs baseline value within group.
bP < .05 vs the moderate group at that point.

