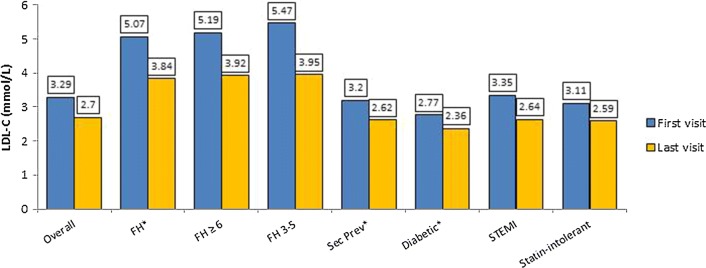
Fig. 1.
Mean LDL-C levels, overall and by subgroup at the first and last visit of the retrospective period (n = 1244 first visit; 1204 last visit). FH, Familial hypercholesterolaemia; FH ≥ 6 and FH 3–5 refer to DLCN scores [12]; SI, patients with symptoms attributed to statin intolerance. For subgroup numbers, see Table S3. *P < 0.001 for last visit values versus rest of study population (Mann–Whitney U test)

