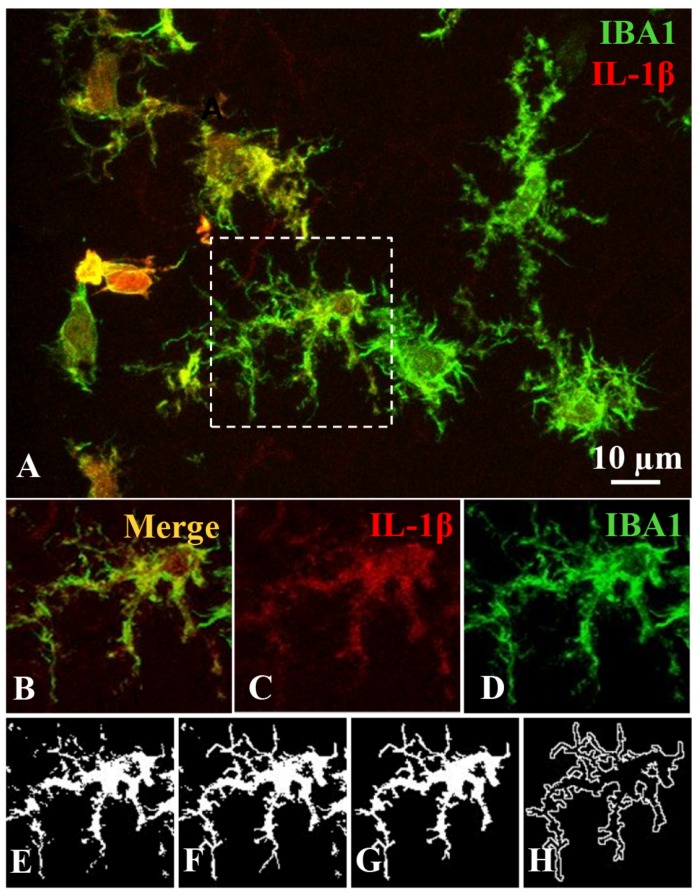
FIGURE 2.
Image processing for an accurate morphometric analysis of individual microglial cells. This procedure was carried out on the same images used for quantifying IL-1β expression level (A). For each single microglial cell, the z-stack planes were projected and grouped, and the resulting image (B) was color-splitted to get the cellular profile displayed by IBA1 staining (green channel; D) out of IL-1β label (red channel; C). The green-channel image (D) was transformed to a binary image (E) and then edited (F) to obtain a single field or area of pixels representing the filled (G) and the outlined (H) shapes of the cell. These filled and outlined figures were used to measure the morphometric parameters.

