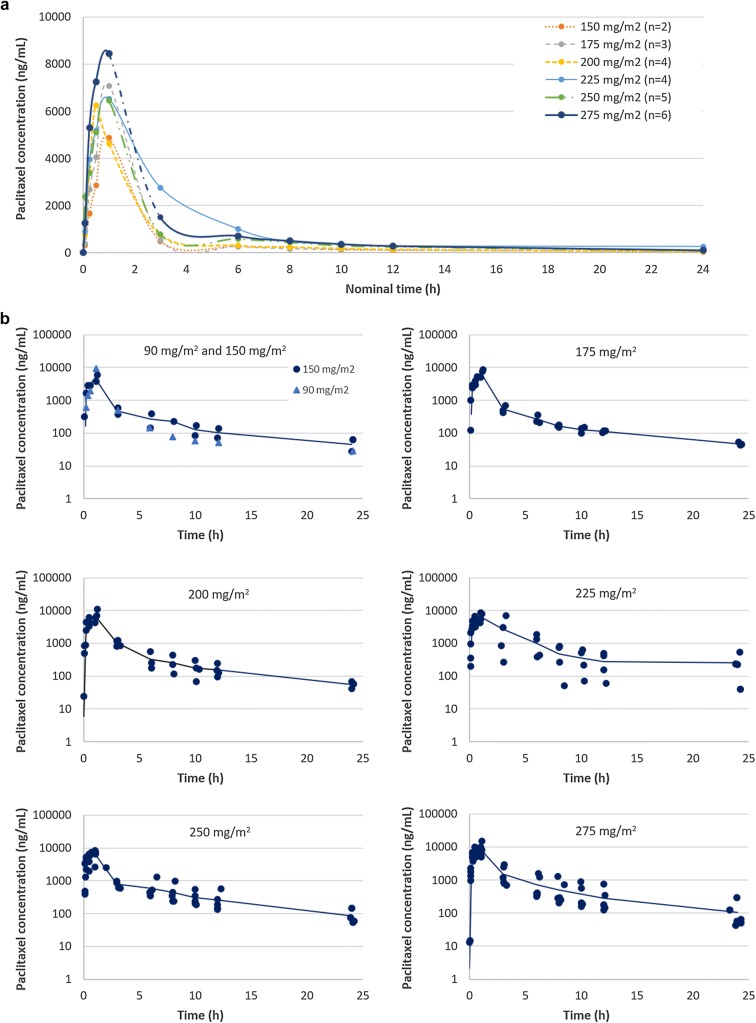
Fig. 2.
Plasma concentration–time curves for total paclitaxel at 1-h infusion of paclitaxel micellar at doses ranging between 90 and 275 mg/m2. a Mean concentrations for each dose level on a linear–linear scale, excluding the 90 mg dose (n = 1) since it is outside the clinical dose range and mainly used to assess safety. b Individual (dots) and mean concentrations (continuous line) of data sets included in the PK evaluation, presented per dose level on log-linear scales. n number of data sets

