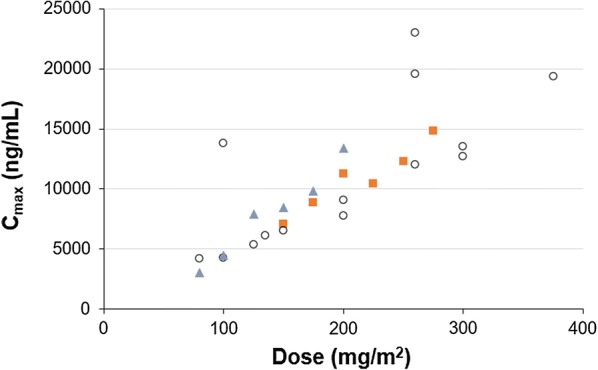
Fig. 4.

Mean Cmax of paclitaxel after 0.5-h infusions of paclitaxel micellar (orange squares) and nab-paclitaxel (empty circles, blue triangles) at various dose levels. Nab-paclitaxel data were extracted from six studies compiled by Stage et al. (empty circles; [14]) and one study by Nyman et al. (blue triangles; [15]). Number of patients per dose level of paclitaxel micellar was as follows: N = 2 (150 mg/m2), N = 3 (175 mg/m2), N = 4 (200 mg/m2), N = 4 (225 mg/m2), N = 5 (250 mg/m2), N = 6 (275 mg/m2)
