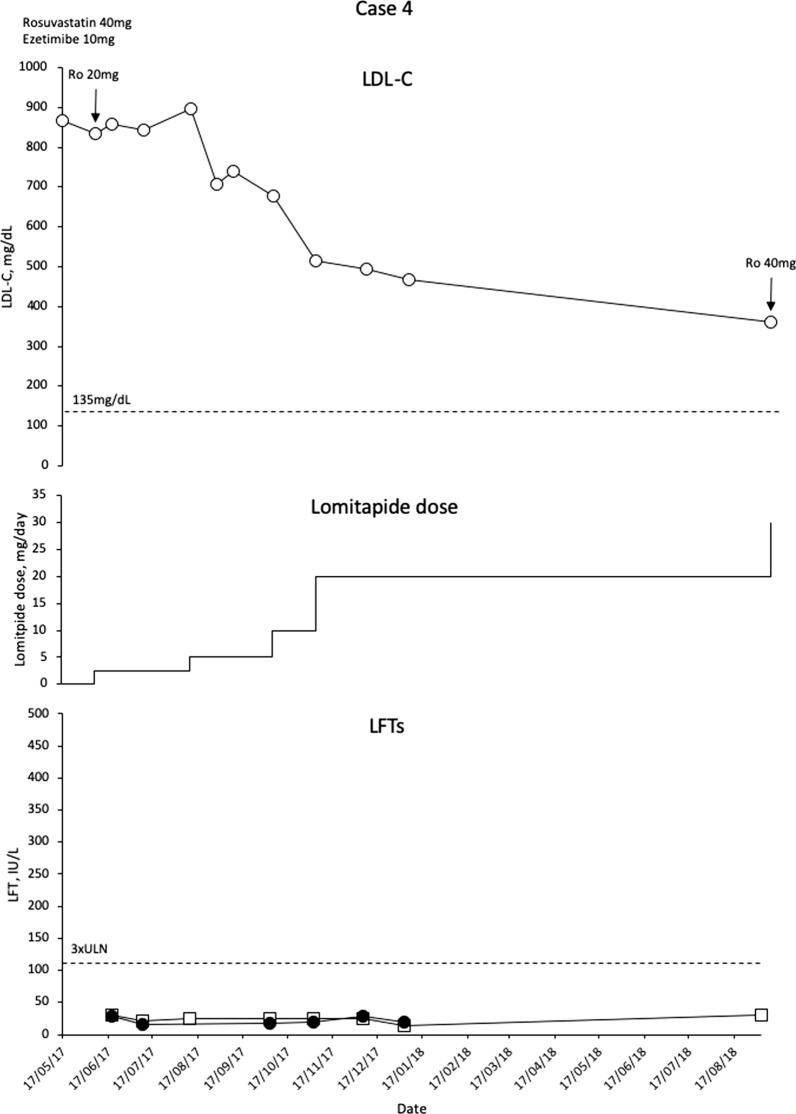
Fig. 4.
Evolution of LDL-C values in case 4 with lomitapide therapy. Upper panel shows mean interval LDL-C levels for patient 4. Middle panel shows lomitapide dose changes over time. Lower panel shows corresponding ALT (closed circles) and AST (open squares) levels over the same period. Dotted line on upper panel shows EAS targets for LDL-C levels in children with HoFH. Dotted line on lower panel indicates 3× upper limit of normal for LFTs; ALT alanine aminotransferase, AST aspartate aminotransferase, EAS European Atherosclerosis Society, HoFH homozygous familial hypercholesterolaemia, LDL-C low-density lipoprotein cholesterol, LFTs liver function tests, ULN upper limit of normal

