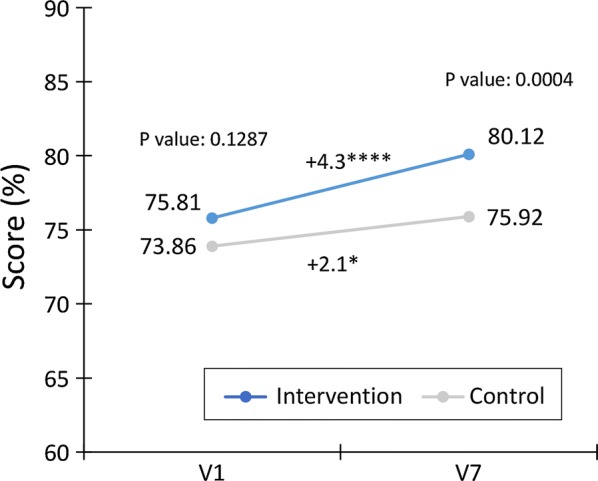
Fig. 2.

Change in global TOP scores (%) from baseline (V1) to 6 months (V7) in the intervention and control groups. Within-group comparisons using Student’s paired t-test: *p < 0.05; ****p < 0.0001. Between-group comparisons using the ANOVA Fisher-Snedecor (p value)
