Figure 4.
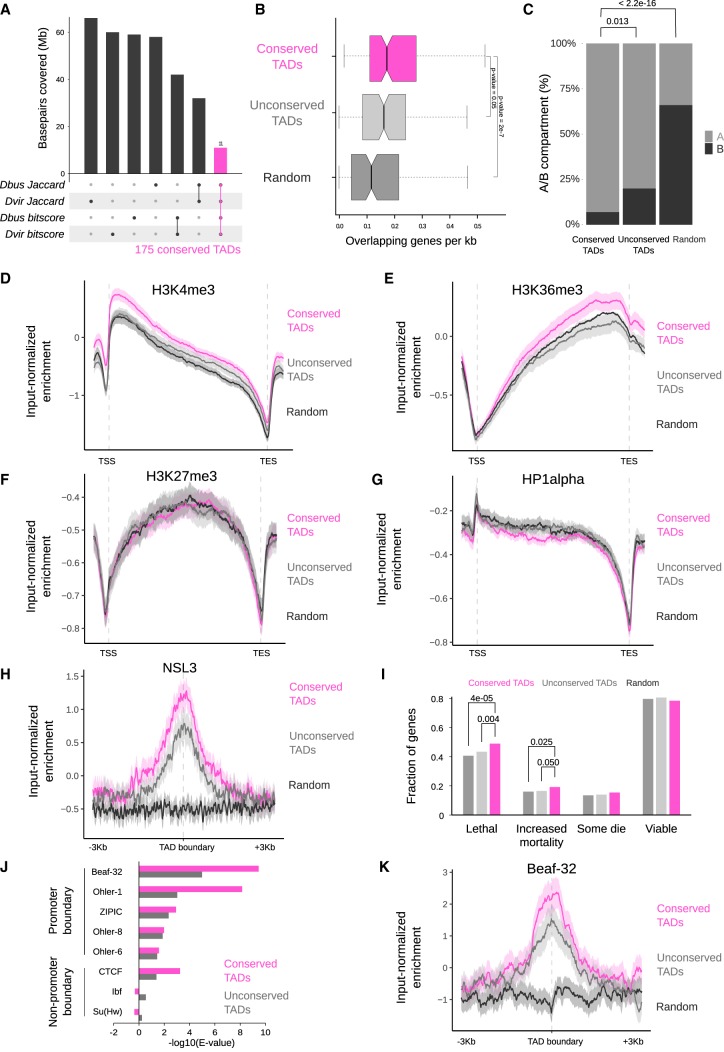
Evolutionary conserved TADs are active gene-rich regions comprising essential genes and are demarcated by conserved boundary motifs. (A) Definition of conserved TADs between D. busckii, D. virilis, and D. melanogaster. TADs with Jaccard similarity index above the median from D. melanogaster versus D. busckii and D. melanogaster versus D. virilis comparisons were overlapped. Respective overlap of TADs were performed using the bitscores. Afterward, TADs found in both analyses were compared and the intersect was defined as conserved TADs. Barplots represent the base-pair coverage of each subset in the D. melanogaster genome. (B) Conserved TADs are gene-dense. Genes overlapping with conserved TADs (pink), unconserved TADs (gray), and random genomic regions (dark gray) expressed in number of genes per kilobase. Equal length of overlapping genes is displayed in Supplemental Figure S6B as a control. Wilcoxon rank-sum test P-values are displayed for comparisons with conserved TADs. (C) Percentage of conserved TADs, unconserved TADs, and random regions that lie completely in the active (A) or inactive (B) compartment (n = 101, 101, 92). P-values were obtained using a two-sided two-proportions z-test. (D–G) Conserved TADs compared to unconserved TADs are significantly enriched in the H3K4me3 (D) and H3K36me3 histone marks (E), but are not enriched in H3K27me3 (F) or HP1α (G). ChIP-seq profiles are from 14- to 16-h old D. melanogaster embryos (Celniker et al. 2009). Log2ratio of H3K4me3, H3K36me3, H3K27me3, and HP1α ChIP-seq reads over input reads along genes (transcription start site [TSS] to transcription end site [TES]) in conserved TADs (pink), unconserved TADs (gray), and random regions (black). ChIP-seq profiles show mean (thick line) and 95% CI (shadowed area) of input-normalized ChIP-seq enrichment along scaled genes and unscaled 1 kb before the TSS and after the TES, computed using deepStats (Richard 2019). (H) Conserved TADs are enriched in the NSL complex member NSL3. Log2ratio of NSL3 (Lam et al. 2012) ChIP-seq reads over input reads at boundaries of conserved TADs (pink), unconserved TADs (gray), and random regions (black) including the 95% CI (confidence interval) obtained from bootstrapping (n = 1000). The NSL3 enrichment at TAD boundaries is significant based on the 95% CI (1.23 ± 0.21 in conserved and 0.78 ± 0.23 in unconserved TAD boundaries). (I) Fraction of genes with “lethal,” “increased mortality,” “some die,” or “viable” phenotypic classes defined in FlyBase automatic summaries (genes can be annotated with several phenotypes, see Materials and Methods). Significant P-values (a = 0.05) for genes intersecting conserved TADs are displayed. They were obtained using one-tailed χ2 test to check for proportion differences in two samples. (J) Enrichment analysis of promoter and nonpromoter boundary motifs at the boundaries of conserved TADs and unconserved TADs in D. melanogaster. Beaf-32 shows the highest motif enrichment at conserved TADs in all three species (see Supplemental Fig. S6G). (K) Conserved TADs show higher enrichment of Beaf-32 at their boundaries than unconserved TADs by input-normalized ChIP-seq reads (Van Bortle et al. 2014).

