Figure 4.
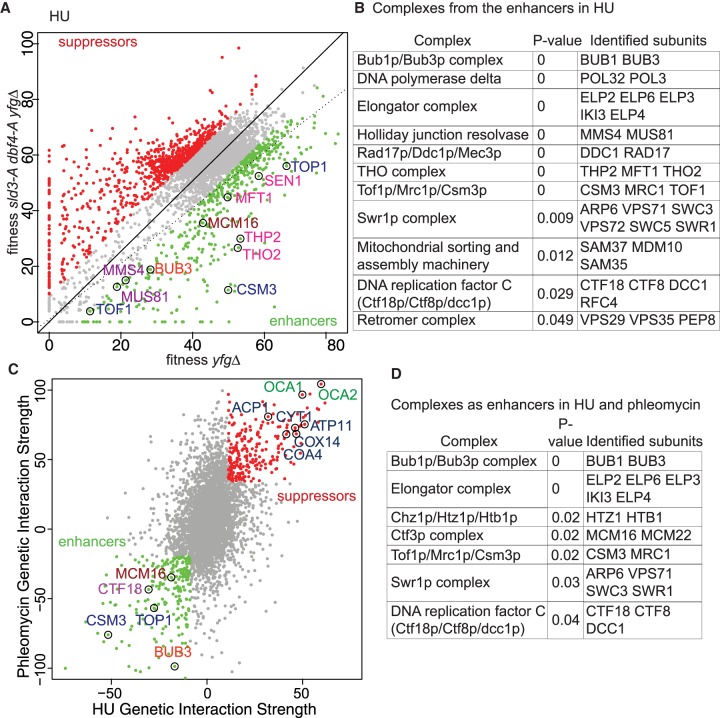
Genetic screens identify pathways that are important in the absence of checkpoint inhibition of origin firing. (A) Scatter plot of the fitness of the yeast genome knockout collection grown in 100 mM HU with (y-axis) or without (x-axis) the sld3-A dbf4-A alleles. Each dot corresponds to a different gene deletion. The top 25% of gene deletions (yfg = your favorite gene) that significantly enhance (green) or suppress (red) the fitness of sld3-A dbf4-A are indicated. The line of hypothetical equal fitness (dotted line) and the line of equal growth derived from a population model of the actual fitness of all the strains (solid line) are indicated. Several examples of the enhancer hits are highlighted and color-coded according to complex/function. (B) Analysis of the enriched protein complexes of the enhancers in A. (C) Genetic interaction strength (GIS) comparison between the screen in A and an equivalent screen performed in 0.5 µg/mL phleomycin. Enhancers and suppressors are highlighted as in A. Several examples of the enhancer/suppressor hits are highlighted and color-coded according to complex/function. The suppressors in blue are involved in mitochondrial function. (D) Analysis of the enriched protein complexes of the enhancers in C.

