Figure 5.
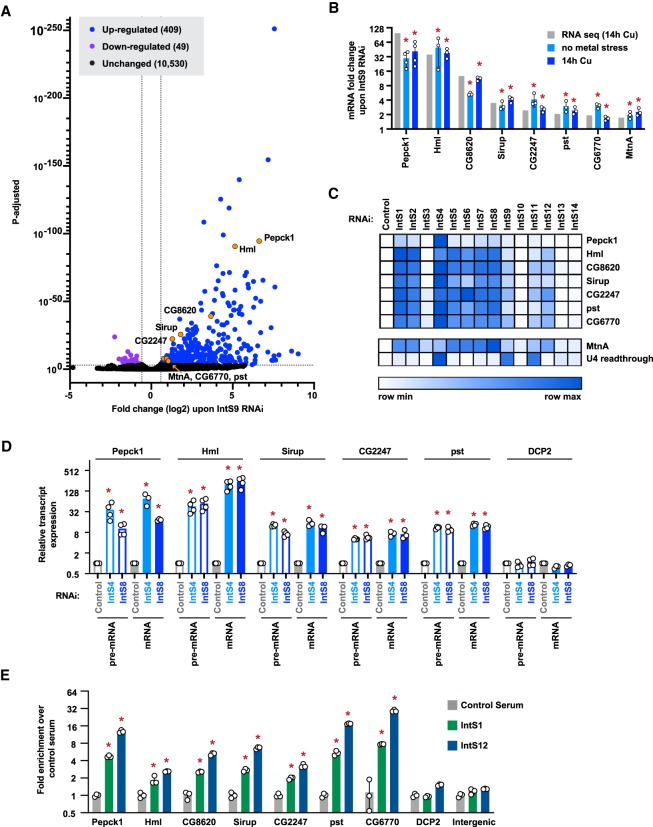
Integrator depletion results in up-regulation of many protein-coding genes. (A) DL1 cells were treated for 3 d with a control (βgal) dsRNA or a dsRNA to deplete IntS9, and CuSO4 was added for the last 14 h. Total RNA was isolated, depleted of ribosomal RNAs, and RNA-seq libraries prepared (three biological replicates per condition). The magnitude of change in mRNA expression compared with statistical significance (P-value) is shown as a volcano plot. Threshold used to define IntS9-affected mRNAs was fold change >1.5 and P < 0.001. (B) To verify the RNA-seq results (gray), DL1 cells were treated for 3 d with a control (βgal) dsRNA or a dsRNA to deplete IntS9 with or without CuSO4 added for the last 14 h (light blue and dark blue, respectively). RT-qPCR was then used to quantify changes in mRNA expression levels. Data were normalized to RpL32 mRNA expression and are shown as mean ± SD compared with treatment with a control dsRNA, N ≥ 3. (*) P < 0.05. (C) DL1 cells were treated with dsRNA to induce RNAi of the indicated factor, and RT-qPCR was then used to quantify changes in mRNA expression levels. CuSO4 was added for the last 14 h only when measuring MtnA mRNA levels. Northern blotting was used to quantify readthrough transcription downstream from the U4:39B snRNA as described in Figure 1E. Data are summarized as a heat map using Morpheus (Broad Institute) with darker shades representing increased transcript expression compared with treatment with a control (βgal) dsRNA. Individual RT-qPCR data points are provided in Supplemental Figure S9. (D) RT-qPCR was used to measure the mRNA and pre-mRNA levels of the indicated transcripts. Data were normalized to RpL32 mRNA expression and are shown as mean ± SD, N ≥ 3. (*) P < 0.05. (E) ChIP-qPCR was used to measure IntS1 and IntS12 occupancy at the indicated promoter regions. Data are shown as fold change relative to the IgG control serum (mean ± SD, N = 3). (*) P < 0.05.

