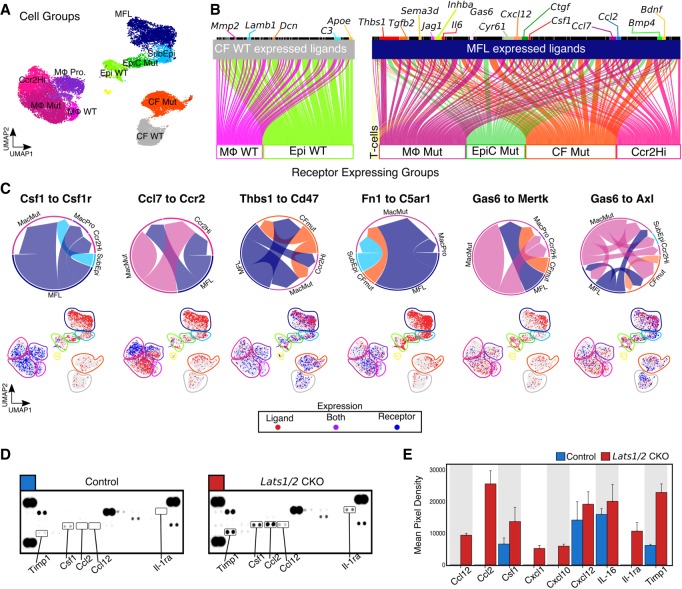
Figure 4.
Yap is a cell-nonautonomous regulator of cardiac cell composition and inflammatory status. (A) UMAP plot of cell groups. MFL, myofibroblast-like cells; SubEpi, sub-epicardial-like cells; EpiC Mut, epicardial cells enriched in Lats1/2 CKO hearts; Epi WT, epicardial cells enriched in control (WT) hearts; CF WT, cardiac fibroblasts enriched in control (WT) hearts; CF Mut, cardiac fibroblasts enriched in Lats1/2 CKO hearts; Mϕ WT, myeloid cells enriched in control (WT) hearts; Mϕ MUT, myeloid cells enriched in Lats1/2 CKO hearts; Mϕ Pro, proliferating myeloid cells; Ccr2Hi, myeloid cell cluster expressing high levels of Ccr2. (B) Ligand-receptor connection analysis. (Left) Control CF ligand-receptor interaction plot. (Right) Lats1/2 CKO-specific MFL-mediated ligand-receptor interaction plot. Lines indicate significant ligand receptor pairs where ligands are expressed in top cell group and receptors are expressed by individual cells in the bottom cell group. Ligands with multiple receptors are largest. (C, top) Circle plots showing the strength of individual ligand-receptor interactions for each indicated group of cells. Size of arrow is proportional to the number of possible cell–cell interactions for each ligand-receptor pair. Base of arrow indicates ligand expressing group, and arrowhead contacts receptor expressing cell group. (Bottom) Feature plots showing the expression of ligand (red), receptor (blue), and cells coexpressing both ligand and receptor (purple). (D) Chemokine protein expression in cardiac lysates determined by cytokine/chemokine protein array. (E) Relative protein expression based on densitometric analysis of Figure 4D. Error bars, SEM.

