Figure 6.
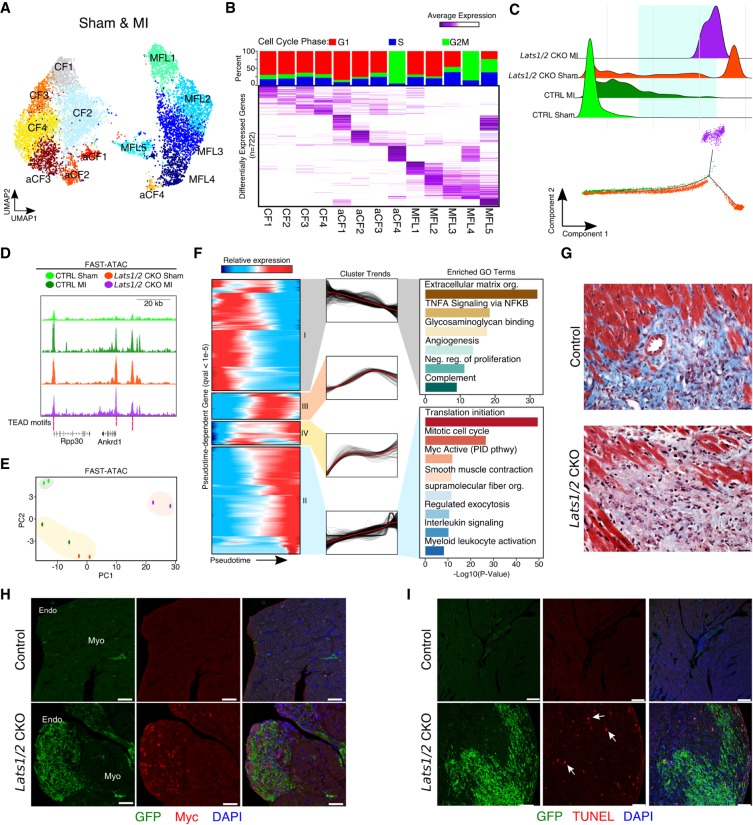
Lats1/2 inhibit Myc expression and limit homeostatic cell replacement to maintain the proper cellular composition of the heart. (A) UMAP plot of cardiac fibroblast clusters. MFL, myofibroblast-like cells; CF, resting cardiac fibroblasts; aCF, activated cardiac fibroblasts. (B) Differential expression analysis and cell cycle phase of cardiac fibroblasts. (Top) Cell cycle phase analysis stacked bar graph of each cluster. Percentage of single-cell transcriptomes within each cluster scored for S-phase (blue), G1 (red), and G2-to-M phase transition (green) is shown. (Bottom) Average expression heatmap of the top differentially expressed cardiac fibroblast marker genes (n = 722). (C, top) Density plot of experimental compositions across pseudotime. (Bottom) Cardiac fibroblast differentiation trajectory. Green square highlights pseudotemporal overlap of control MI and Lats1/2 CKO CFs. (D) Genome browser tracks for Fast-ATAC. All libraries scaled equally. (E) Principal component analysis (PCA) of Fast-ATAC signals from biological duplicates of FACS sorted GFP+ cardiac fibroblasts from control and Lats1/2 CKO hearts with and without myocardial infarction. (F) Dynamic cardiac fibroblast expression patterns across differentiation following myocardial infarction. (Left) Hierarchically clustered heatmap of gene expression dynamics (q-value <1 × 10⁻⁵). (Middle) Global cluster gene expression trends across pseudotime. (Right) Gene ontology analysis for cluster I (top) and cluster II (bottom). (G) High-magnification view of Masson's trichrome stained histological sections derived from control and Lats1/2 CKO hearts 3 wk post-MI. Scale bar, 25 µm. (H) Expression of Myc (red) control and Lats1/2 CKO cardiac fibroblasts (green). Nuclei stained with DAPI (blue). Endo, endocardium; Myo, myocardium. Scale bar, 25 µm. (I) Representative images of TUNEL stained control and Lats1/2 CKO hearts without injury. Cardiac fibroblasts (green), apoptotic cells (red), nuclei (blue). See also Supplemental Figure S5F. Scale bar, 100 µm.

