Figure 7.
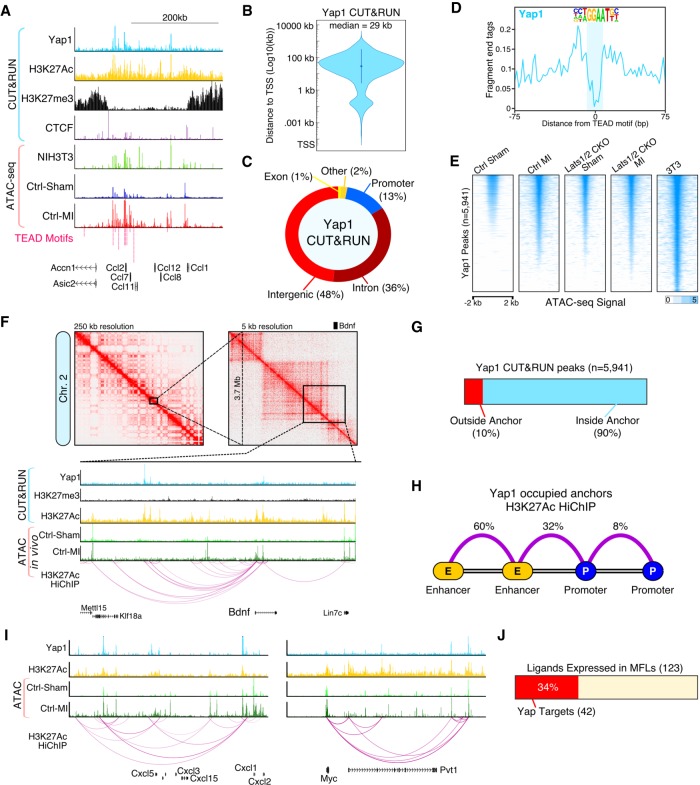
The Yap enhancer connectome engages the immune system. (A) Genome browser tracks for Yap CUT&RUN and Fast-ATAC. (B) Violin plot showing the absolute distance of Yap peaks to the nearest transcription start site (TSS). (C) Fraction of Yap CUT&RUN peaks annotated with each category. (D) CUT&RUN footprint analysis for Yap at TEAD motifs. (E) Heatmap showing Fast-ATAC signal (read depth) across all myofibroblast Yap binding sites (n = 5941, P-value <1 × 10⁻⁵) for indicated experimental conditions. (F) H3K27Ac HiChIP interaction maps for in vitro myofibroblasts (NIH3T3 cells). (Top) Knight-Ruiz matrix-balanced HiChIP interaction maps plotted using Juicebox (Durand et al. 2016) at 250-and 5-kb resolutions. (Bottom) Browser tracks showing CUT&RUN, Fast-ATAC, and 3D HiChIP interaction signals. (G) Fraction of Yap CUT&RUN peaks located within H3K27Ac loop anchors. (H) H3K27Ac HiChIP loop interaction summary for Yap occupied loops. (I) Genome browser tracks for Cxcl5 and Myc. (J) Fraction of MFL expressed ligands (Fig. 4B) that are direct Yap target genes.

