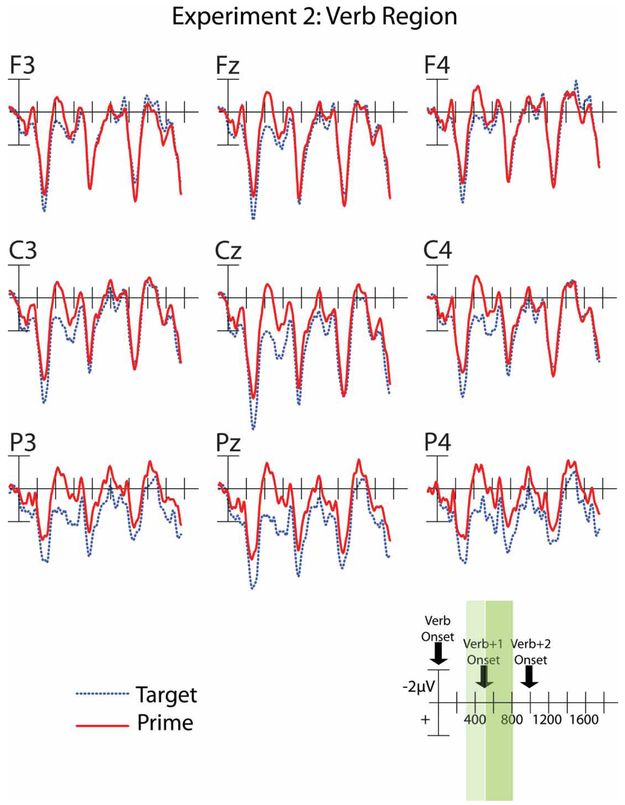
Figure 1.
Effect of type for the verb region for Experiment 2. Red lines represent waveforms in response to the prime sentence; in blue (dotted line) is the response to the target sentence. Nine electrodes representing frontal, central, and posterior sites are shown. Negative is plotted up. The verb region is shown (2000-ms epoch), covering the main verb, verb + 1 and verb + 2. The N400 time window (for the main verb) appears shaded in light green (light gray), while the P600 time window is shaded in darker green (dark gray). To view a colour version of this figure, please see the online issue of the Journal.

