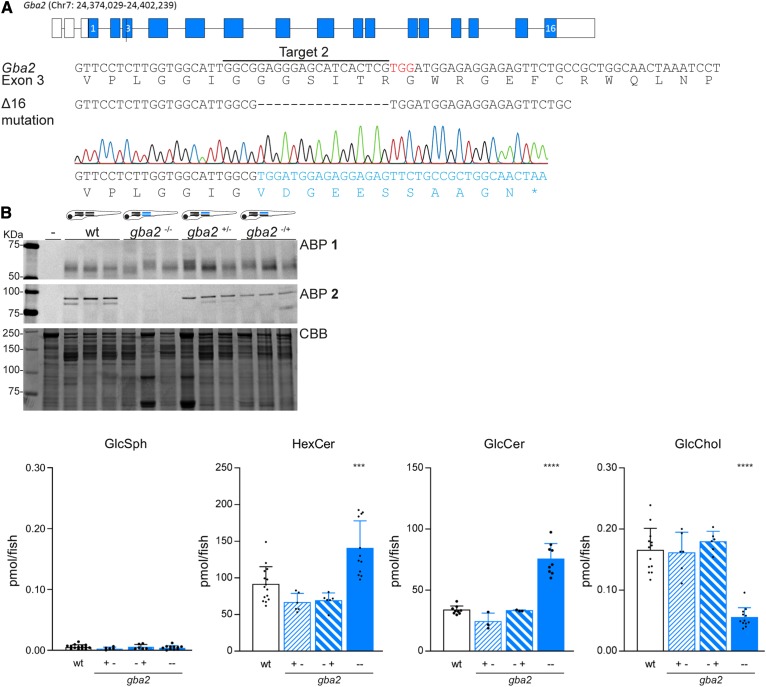
Fig. 3.
CRISPR/Cas9-mediated disruption of Gba2 in zebrafish. A: Top panel: Schematic representation of gba2 gene on chromosome 7. Middle panels: DNA sequence of exon 3 of gba2 with the sgRNA target sequence underlined, the PAM site in red, and the protein sequence shown below. Lower panel: The 16 bp deletion (Δ16), as obtained from the sequence trace, introduces a premature stop codon (*) in the altered predicted translated protein sequence, given in blue. B: ABP labeling of homogenate of individual zebrafish larvae at 5 dpf (WT, gba2−/−, and both heterozygous gba2+/− options, n = 3) with ABP 1 (top panel) or ABP 2 (middle panel). In lane –, sample is denatured prior to ABP addition; CBB staining was used as loading control. C: GlcSph, HexCer, GlcCer, and GlcChol levels were determined of individual zebrafish larvae in picomoles per fish; WT (n = 15), gba2+/− (n = 6), gba2−/+ (n = 6), and gba2−/− (n = 12) for GlcSph, HexCer, and GlcChol; and WT (n = 9), gba2+/− (n = 3), gba2−/+ (n = 3), and gba2−/− (n = 9) for GlcCer. Data are depicted as mean ± SD and analyzed using one-way ANOVA (Dunnett’s test) with WT as control group with ***P < 0.001 and ****P < 0.0001.

