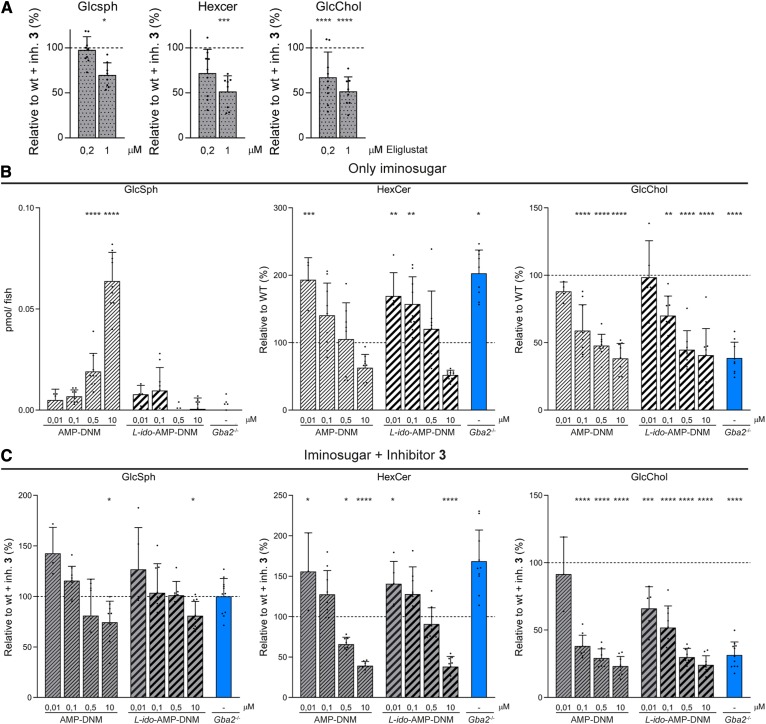
Fig. 6.
Pharmacological inhibition of Gba1, Gba2, and Gcs. A: WT embryos were treated simultaneously with inhibitor 3 (inh. 3) and eliglustat. Lipid levels were determined of individual larvae (n = 8–9). Ratios of GlcSph, HexCer, and GlcChol are depicted relative to WT embryos incubated with inhibitor 1 only (100% line). B: WT embryos were incubated for 5 days with different concentrations of AMP-DNM (striped bars) or L-ido-AMP-DNM (thicker striped bars) and lipid levels were determined of individual larvae (n = 5–9). Data of GlcSph are depicted in picomoles per larvae, while ratios of HexCer and GlcChol are depicted relative to vehicle-treated WT (100% line). C: WT embryos were treated with inhibitor 3 (10 μM) and different concentrations of AMP-DNM (striped bars) or L-ido-AMP-DNM (thicker striped bars) and lipid levels were determined of individual larvae (n = 5–9). Data of GlcSph, HexCer, and GlcChol are depicted relative to inhibitor 3-treated WT (100% line). Inhibitor 3-treated gba2−/− (blue bar) is used as control for pharmacological Gba1 inhibition in a full genetic Gba2-deficient background. Data are depicted as mean ± SD and analyzed by one-way ANOVA (Dunnett’s test) with WT as control group. *P < 0.05, **P < 0.01, ***P < 0.001, and ****P < 0.0001.

