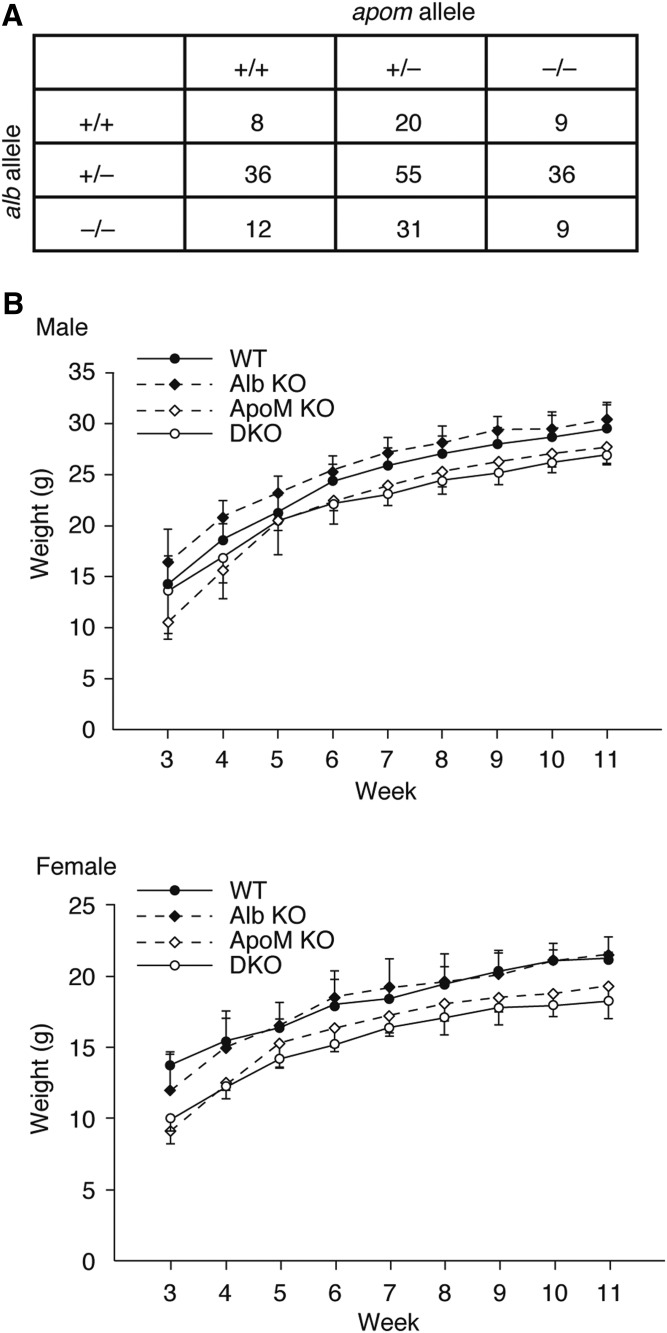
Fig. 1.
ApoM KO, Alb KO, and DKO mice. A: Alb+/−/Apom+/− double-heterozygous mice were intercrossed. The number of the pups with each genotype are shown, which are not significantly different from the Mendelian ratio (P = 0.086 in Chi-square goodness of fit test). B: Body weights of the mice under normal chow were recorded every week after weaning (at 3 week) until they were 11 weeks old. Data are shown as mean ± SD (n = 4–8). A multiple linear regression model was applied to examine the statistical differences of the growth curves between the four groups (supplemental Fig. S1). Significant differences (P < 0.05) were observed in WT versus Alb KO, WT versus ApoM KO, and WT versus DKO in the male group and in WT versus ApoM KO and WT versus DKO in the female group.

