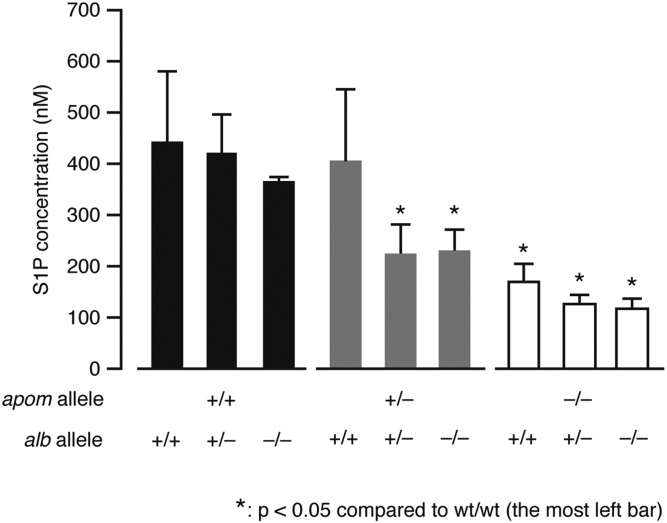
Fig. 3.
Total S1P concentrations in the mouse plasma. Plasma samples were collected from each genotype of mice and the S1P concentrations were determined by LC-MS/MS analysis (mean ± SD, n = 4). One-way ANOVA was performed, followed by the post hoc Tukey-Kramer’s multiple comparison test (*P < 0.05).

