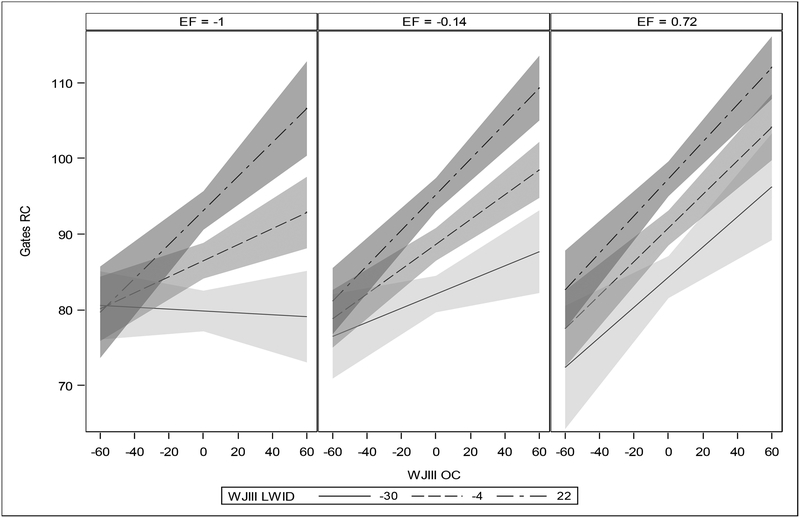
Figure 1a.
Performance on reading comprehension (Gates MacGinitie) is shown as a function of common executive function (EF; panels from left to right, representing low, average, and high EF, respectively), listening comprehension (WJ-III Oral Comprehension subset, WJ-III OC; along x axis), and single word reading (WJ-III Letter-Word Identification, WJ-III LWID, represented by low (lightest gray), average, and high (darkest gray) LWID slopes within each panel). Bands around slopes reflect standard error, and graphs are considered at the sample mean of all other variables in the model.
Three way interaction of common executive function (EF) with simple view variables (decoding and listening comprehension) on reading comprehension.

