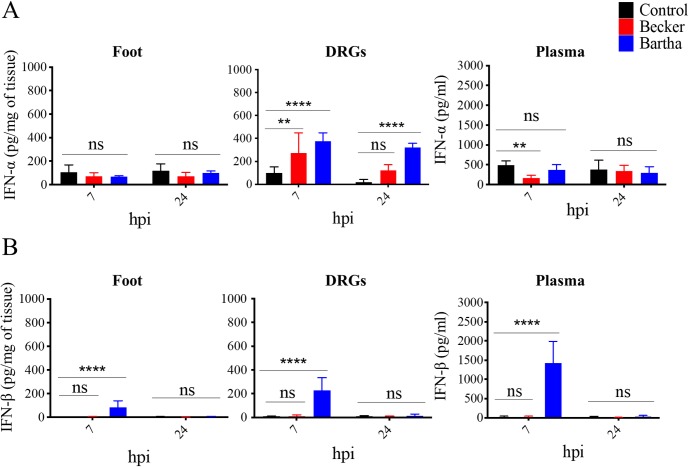
Fig 5. Comparison of type I IFN levels between PRV-Becker and PRV-Bartha infected mice at early time post-infection.
(A) IFN-α and (B) IFN-β protein levels detected in the foot, DRGs and plasma of control (black), PRV-Becker (red) and PRV-Bartha (blue) infected WT mice at 7 and 24 hpi. Protein levels were quantified by ELISA and expressed as picogram (pg) per milligram (mg) of tissue. Three independent experiments were performed. Five mice per group were used per experiment. ** P< 0.01; **** P< 0.0001; ns, not significant.

