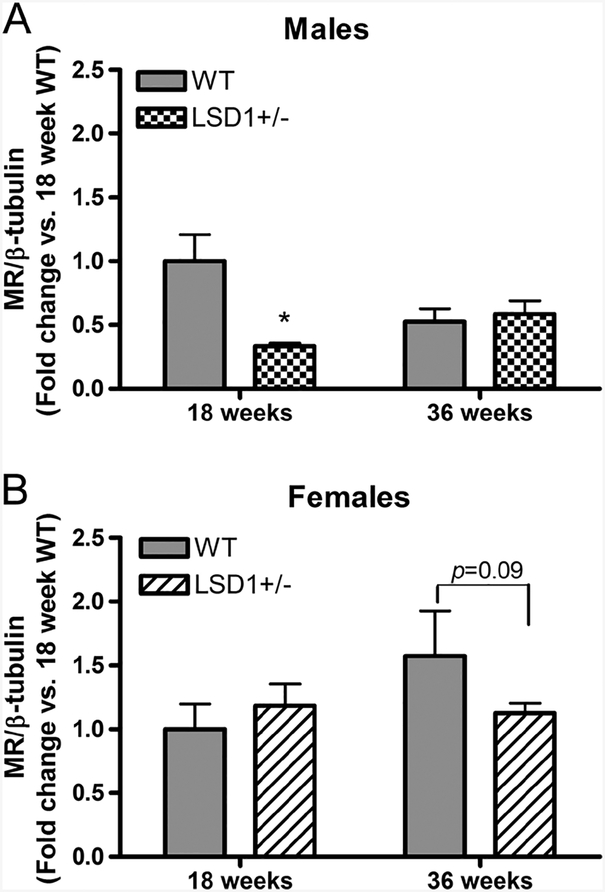
Figure 5.
Cardiac MR protein levels relative to β-tubulin in male (A) and female (B) mice. Data represent mean ± S.E.M. (n = 6/group). Statistical analyses were conducted using unpaired t-test (two-tailed) for (A) and Fisher’s exact test for (B). Gels for MR and β-tubulin immunoreactive bands are presented at the bottom of corresponding graphs. *P < 0.01 vs same-age WT.

