Fig. 3.

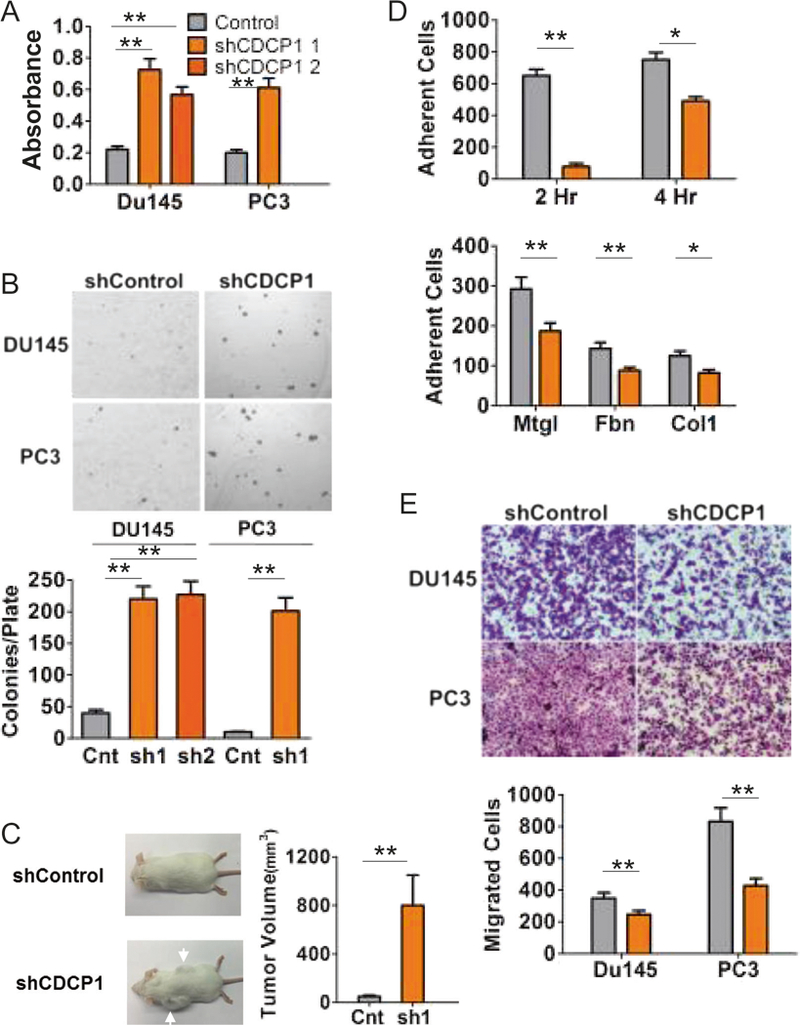
CDCP1 loss changes cell behavior. a MTT assay of DU145 and PC3 CDCP1 knockdown (shCDCP1) or control hairpin (Control) cells suspended in a HEMA-coated 96-well plate for 24 h. b Soft agar colony formation assay of DU145 and PC3 shControl and CDCP1 knockdown (shCDCP1). Colonies were quantified using ImageJ. c Xenograft mouse model. 1 × 10⁶ DU145+/−CDCP1 were injected subcutaneously in 9-week-old male beige SCID mice. Tumors were harvested after 9 weeks and the volumes shown in the bar graph. d Adhesion assay of DU145 shControl (gray bars) and CDCP1 knockdown shCDCP1 (orange bars). Cells were adhered for 2 or 4 h to surfaces coated with Matrigel (Mtgl), Fibronectin (Fbn), or Collagen I (Col1). Adherent cell numbers per 20× field, averaged from eight measurements, are plotted on the y-axis. e Serum (10%)-induced migration assay of DU145 and PC3 through a 0.8 μM Transwell membrane. Migrated cells were stained using crystal violet and quantified with ImageJ. *P < 0.05 and **P < 0.01
