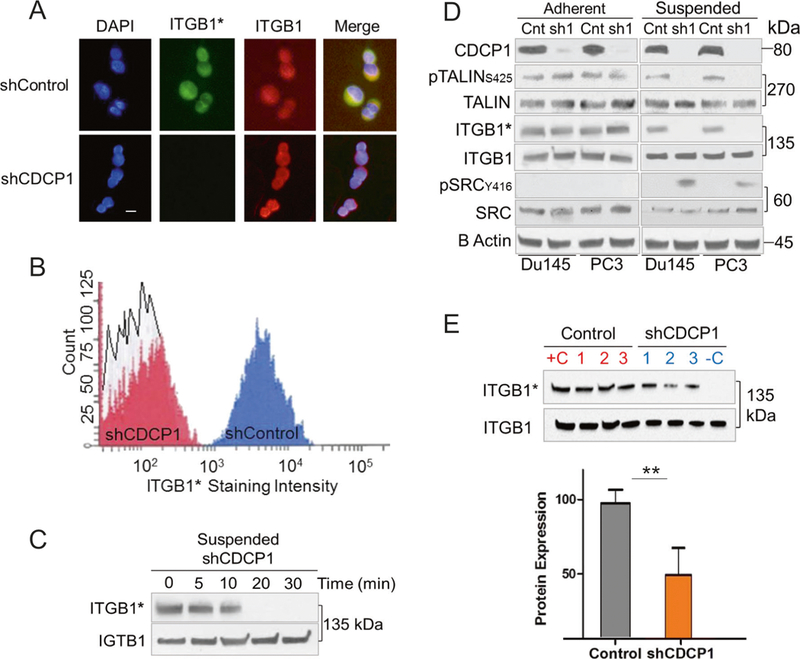
Fig. 4.

CDCP1 silencing inhibits inside-out activation of ITGB1/β1-integrin and activates c-SRC in suspended cells. a Immunofluorescent staining of CDCP1-positive (shControl) and negative (shCDCP1) DU145 cells on coverslips. The HUTS-4 antibody was used to determine the activation state of ITGB1/β1-integrin (green: active ITGB1*), total ITGB1/β1-integrin (red), and nuclei (blue). White bar = 10 μM. b FACS analysis with HUTS-4 antibody. The staining intensity with HUTS-4 is plotted on the x-axis. The y-axis reveals the number of cells. c Time course of ITGB1/β1-integrin inactivation Active ITGB1/β1-integrin (ITGB1*) and total ITGB1/β1-integrin (ITGB1) were measured after suspending DU145 CDCP1 knockdown cells for the times indicated. d Activation of ITGB1/β1-integrin in adherent and suspended (3 h) DU145 and PC3 cells. Cells were analyzed after CDCP1 (sh1) or scrambled control (Cnt) knockdown. e Active ITGB1/β1-integrin (ITGB1*) and total ITGB1/β1-integrin (ITGB1) in protein lysates from three control and CDCP1-silenced xenografts [1–3]. Quantification normalized to total ITGB1/β1-integrin on y-axis. *P < 0.05 and **P < 0.01
