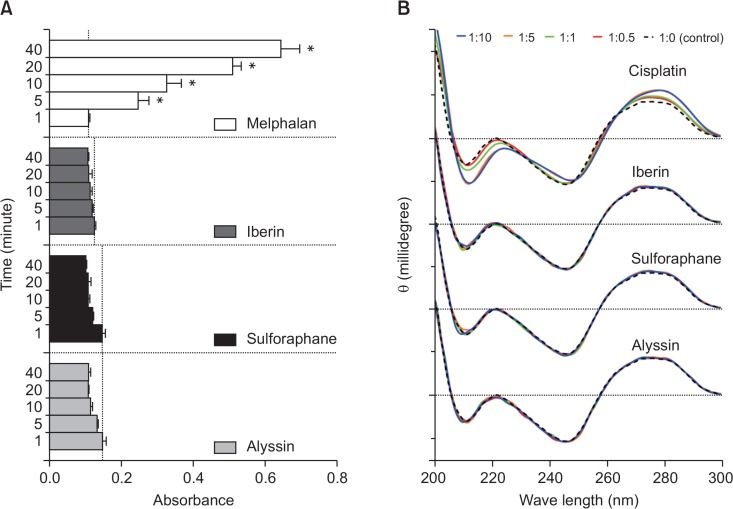
Fig. 5.
ITCs-DNA interactions. Alkylating activity of ITCs compared with melphalan (positive control) according to NBP assay (A). CD spectra of calf-thymus DNA at constant concentration (50 μM) after incubated with ITCs or cisplatin (positive control) at various concentrations (25–500 μM) (B). In NBP assay, results displayed as mean ± SD (n=3) and asterisk (*) indicates statistically significant increases (p<0.05) compared to absorbance at 1 min in each treatment group.

