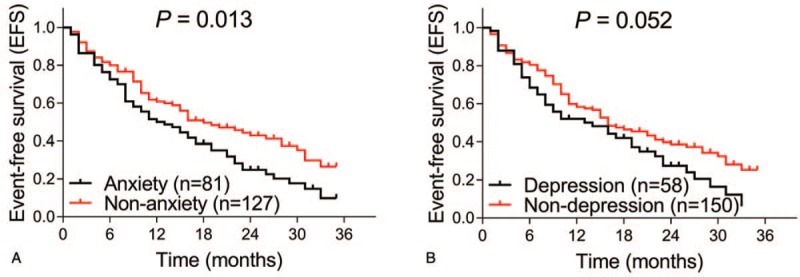
Figure 3.

Correlations of anxiety and depression with EFS. The EFS between anxiety patients and nonanxiety patients (A), and between depression and nondepression patients (B) are shown. Kaplan-Meier curves were plotted to illuminate the EFS, and the log-rank test was used to analyze the difference of EFS between groups. P value of less than .05 was applied as the threshold for significance. EFS = event-free survival.
