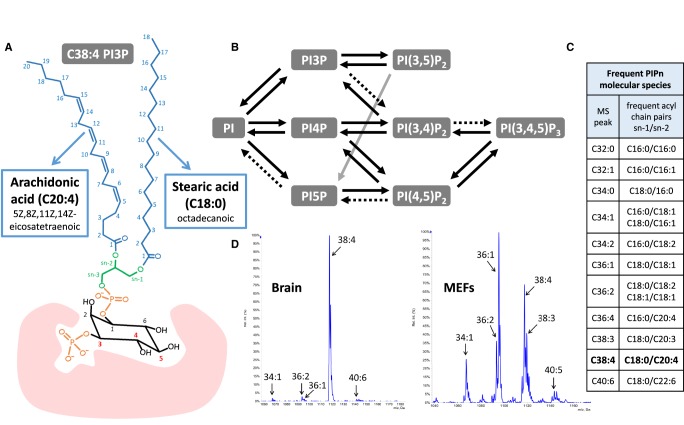
Figure 1. Phosphoinositide structures, metabolism and interactions with effectors.
(A) A typical phosphoinositide (PIPn) structure is represented by C38:4 PI3P (sn-1-stearoyl-2-arachidonoyl phosphatidylinositol 3-phosphate). The fatty acids acylated in the sn-1 and sn-2 positions of the glycerol backbone (green) are labelled with both their common and systematic name, and with the lipid nomenclature based on the number of carbons and double bonds in brackets. The three positions in the inositol ring which can be phosphorylated or dephosphorylated by specific kinases and phosphatases to give rise to the different members of the PIPn family are indicated by red numbers. The pink cartoon engulfing the phosphorylated ring represents a specific interaction between the phosphorylated inositol ring and the binding domain of a PIPn effector protein. (B) Pathways of PIPn metabolism indicating their dynamic interconversion by kinase and phosphatase reactions acting on different positions on their inositol rings. Disputed activities are indicated with dashed arrows. (C) List of PIPn molecular species frequently identified by MS analysis. When their acyl chain composition is not resolved by further fragmentation, they are expressed by the total number of carbons and double bonds in both chains. (D) MS profile of the PIP2 molecular species found in mouse brain and mouse embryonic fibroblasts (MEFs) (adapted from [123]). The three PIP2 isomers are not resolved by this method, though PI(4,5)P2 generally accounts for most of the signal. While brain PIP2 shows the predominance of C38:4 species characteristic of mammalian PI, this enrichment can be lost in cultured cells such as MEFs, which present an heterogeneous distribution of molecular species in all PIPn.

