Figure 1.

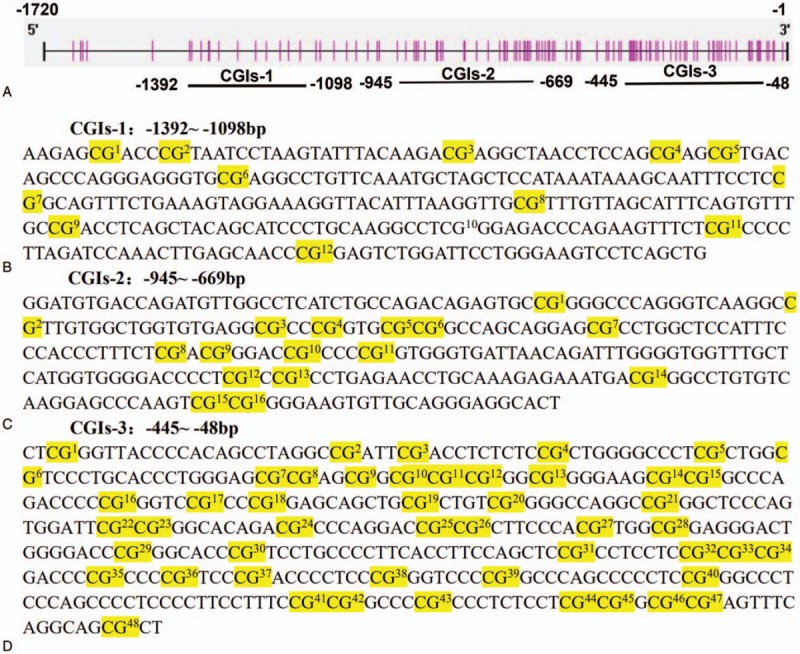
(A) The location of the hTERT promoter region and 3 CGIs regions; (B), (C), and (D) are the 3 CGIs regions and CG sites.

(A) The location of the hTERT promoter region and 3 CGIs regions; (B), (C), and (D) are the 3 CGIs regions and CG sites.