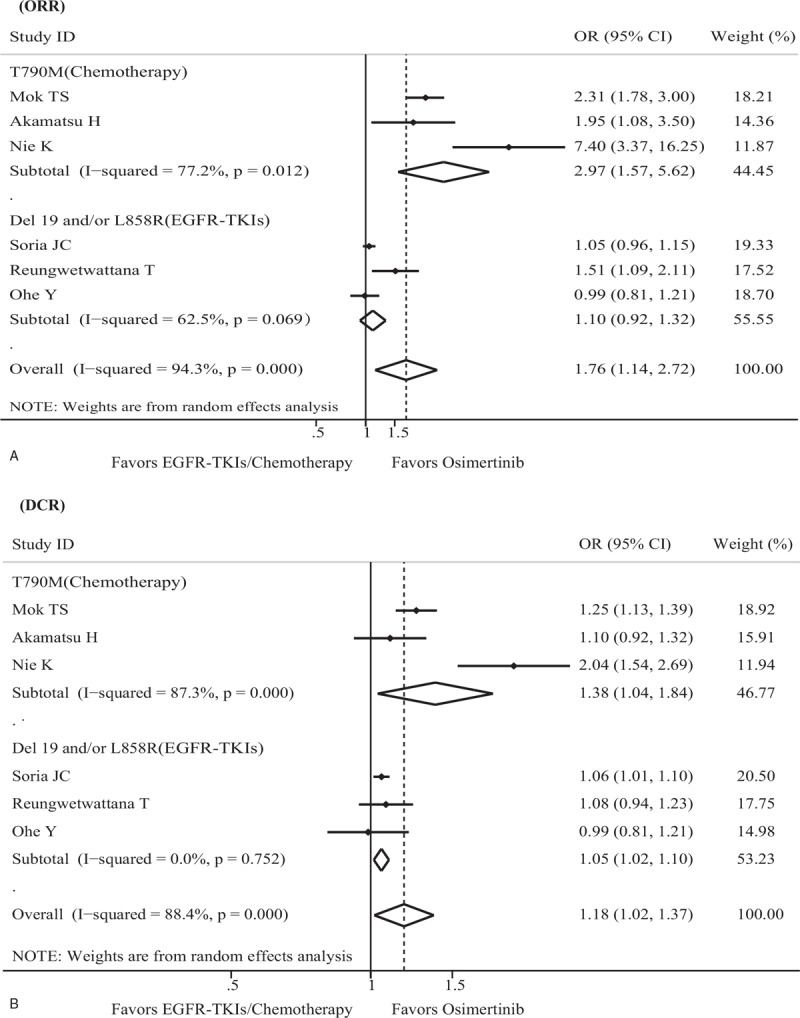
Figure 4.

Randomized treatment effect on ORR and DCR. (A) Forest plot of the effect of treatment on the ORR. (B) Forest plot of the effect of treatment on the DCR. CI = confidence interval, DCR = disease control rate, EGFR-TKI = epidermal growth factor receptor tyrosine kinase inhibitor, OR = odds ratio, ORR = overall response rate.
