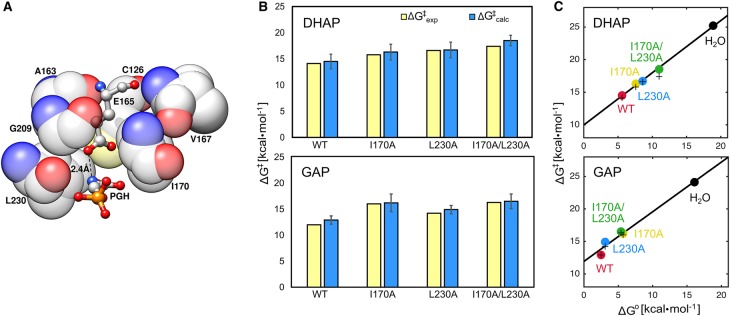
Figure 3. Modeling the Hydrophobic Clamp of TIM.
(A) An illustration of the hydrophobic clamp in TIM, formed by the hydrophobic side chains of residues I170 and L230 clamping the catalytic base E165. This figure is based on the active site of wild-type TbbTIM (PDB ID: 1TRD [81,82]), in complex with the intermediate analog phosphoglycolhydroxamate (PGH). (B) A comparison of experimental (ΔG‡exp, yellow) and calculated (ΔG‡calc, blue) activation free energies for the deprotonation of (top) DHAP and (bottom) (R)-glyceraldehyde 3-phosphate (GAP) by wild-type and mutant TIMs. (C) The correlation between the experimental (+) and calculated (●) activation free energies (ΔG‡), and the calculated reaction free energies (ΔG0) for the deprotonation of (top) DHAP and (bottom) GAP by wild-type and mutant TIMs. Here, the correlation coefficients, calculated by linear regression analysis, are 0.9987 and 0.9921 for DHAP, and 0.9898 and 0.9909 for GAP (experimental and calculated values, respectively). All energies are presented in kcal·mol−1. This figure is adapted from and based on data presented in ref. [31] (https://pubs.acs.org/doi/pdf/10.1021/jacs.7b05576), and is reproduced with permission from the American Chemical Society. Please note that requests for permissions regarding further reuse of this figure should be directed to the American Chemical Society.

