. 2019 Oct 15;8:e48508. doi: 10.7554/eLife.48508

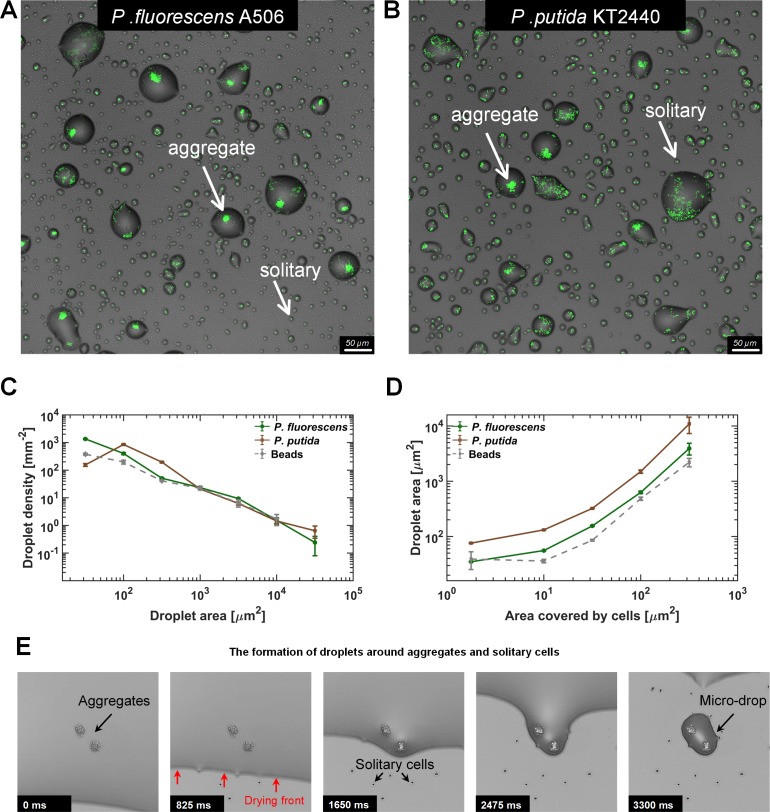
Figure 2. Microdroplets form around bacterial cells and aggregates.

(A–B) Representative sections of the surface imaged 24 hr after macroscopically dry conditions were established. Bacterial cells (pseudo color in green) that colonized the surface during the wet phase of the experiment are engulfed by microdroplets, while uncolonized portions of the surface appear to be dry. Solitary cells are engulfed by very small microdroplets, while large aggregates are engulfed by larger droplets (white arrows). Images show a 0.66 × 0.66 mm section from an experiment with P. fluorescens (A) and P. putida (B). (C) Droplet-size distributions at 24 hr: Droplets from both strains show power law distributions with relatively similar exponents (γ = −1.2 ± 0.15 (mean ± SEM) and −1.0 ± 0.45 for P. fluorescens and P. putida, respectively). (D) Droplet size as a function of cell abundance within the droplet (estimated by area covered by cells): Droplet size increases with cell abundance within the droplet. Error bars in (C) and (D) are standard errors. (E) A time-lapse series capturing the formation of microdroplets around bacterial aggregates: The thin (a few µms) liquid receding front clears out from the surface, leaving behind microdroplets whenever it encounters bacterial cells or aggregates (see also Videos 13).

Figure 2—source data 1. Droplet size distributions and their relation to area covered by cells.
Figure 2C: Droplet count within per mm2 of surface. Droplet count within a scale of area ranges, per mm2 of surface - mean value and standard error calculated for data groups. Raw data: Each row represents a single droplet. Droplet areas are given in μm2. 'repeat' values are the identifiers of the specific field of view. Figure 2D: Mean value and standard error of droplet area, binned by the area covered by cells within host droplet. Raw data: droplet area vs area covered by cells inside the droplet. Areas are given in μm2.
DOI: 10.7554/eLife.48508.011

Figure 2.

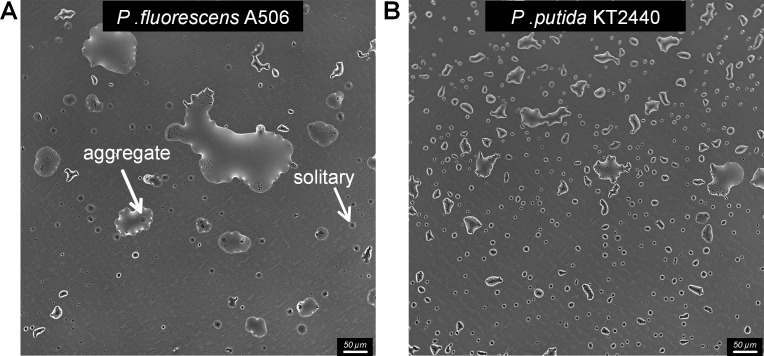
Figure 2—figure supplement 1. The formation of microdroplets on polystyrene substrate.

Figure 2—figure supplement 1.

(A) Drying surface experiment with P. fluorescens on a polystyrene 6-well plate (Costar 6-well Plate, Corning). Representative sections of the surface imaged 48 hr after macroscopically dry conditions were established. Solitary cells are engulfed by small-size droplets, while aggregates are found in larger droplets. (B) Same as in (A) but with P. putida.
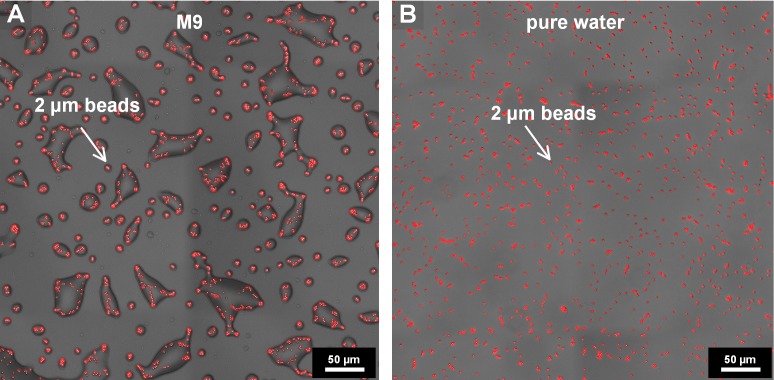
Figure 2—figure supplement 2. Drying surface experiment with fluorescent beads (2 μm in diameter).

Figure 2—figure supplement 2.

(A) Drying experiments were performed under same conditions as the experiments with bacteria (M9 diluted 0.5x, 28°C, 85% RH; see Materials and methods). (B) Drying experiment with fluorescent beads suspended in pure water (28°C, 85% RH). In the absence of deliquescent substrates, no droplets formed.
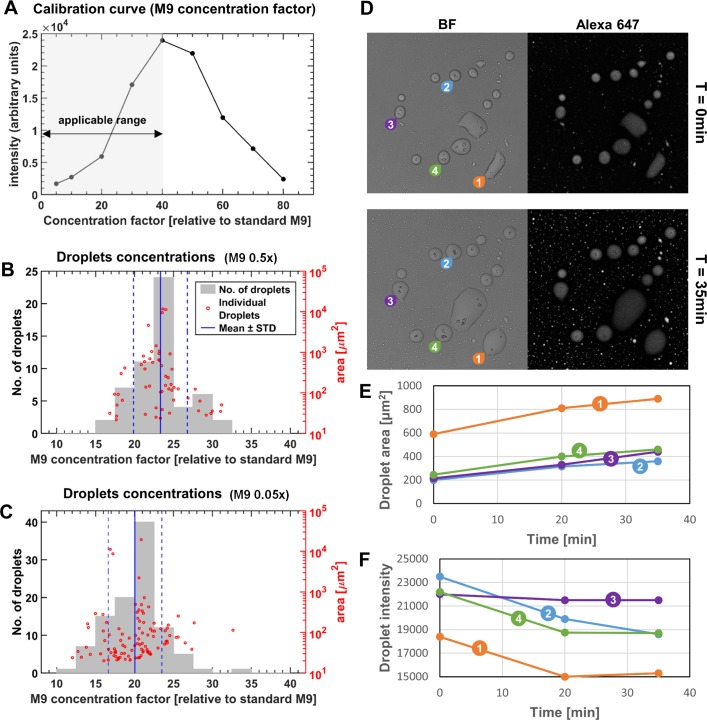
Figure 2—figure supplement 3. Estimating the solute concentrations in microdroplets in comparison to standard M9 medium.

Figure 2—figure supplement 3.

(A) In order to estimate the solute concentrations in the microdroplets, several drops of M9 medium concentrated to known ‘concentration factors’ (relative to standard M9) were imaged by a confocal microscope, and their mean intensities were measured (see Materials and methods). The relationship between the drop concentration and fluorescence intensity constituted the calibration curve. (B–C) Microdroplet concentration factor was estimated by extracting the mean intensity of the microdroplets formed on a drying surface with beads, and interpolating the corresponding M9 concentration factors. The concentration factor and area of the individual microdroplets are shown as red circles; the concentration factor’s histogram is shown in gray bars. (B) Initial medium was half-strength M9 (diluted 0.5x), similarly to the experiments presented in Results. Microdroplet concentration factor was 23.3 ± 3.5 (Mean ± SD) relative to standard M9. Pearson correlation coefficient of droplet area and concentration is 0.005 (p-value=0.97). (C) Initial medium was 0.05x diluted M9. Microdroplet concentration factor was 20.0 ± 3.4 (Mean ± SD) relative to standard M9. Pearson correlation coefficient of droplet area and concentration is 0.05 (p-value=0.64). (D–F) The M9 calibration curve in (A) is not monotonous over the entire concentration factor range, and changes from increasing intensities for concentration factors < 40, to decreasing at >40 (likely due to one or more of the medium substrates that affect fluorescence intensity). The appropriate range for calibration was determined by testing whether the intensity increases or decreases following induced changes to concentration factors. To that end, stable microdroplets that formed at 85% RH were placed under higher RH conditions (~95%). (D) Bright field and Alexa fluorescence images at t = 0 and t = 35 min following raise in RH. Four droplets (marked by numbers 1 to 4) at t = 0, 20, 35 min after the change in RH. (E) Microdroplet areas (and presumably volumes) increased by absorbing water from the environment, and (F) Microdroplet mean intensities decreased (line colors match the microdroplet tags in (D)). This result indicates that, at these settings, correlation between intensities and concentration is positive, in turn indicating that the appropriate calibration range is for concentration factors below 40, relative to standard M9.
Figure 2—figure supplement 3—source data 1. M9 calibration: relation between concentration factor relative to standard M9 vs intensity.
M9 0.5x, M9 0.05x: distribution of droplets' concentration (for corresponding initial concentration). Raw data: concentration factor vs area [um^2] for all droplets.
DOI: 10.7554/eLife.48508.008
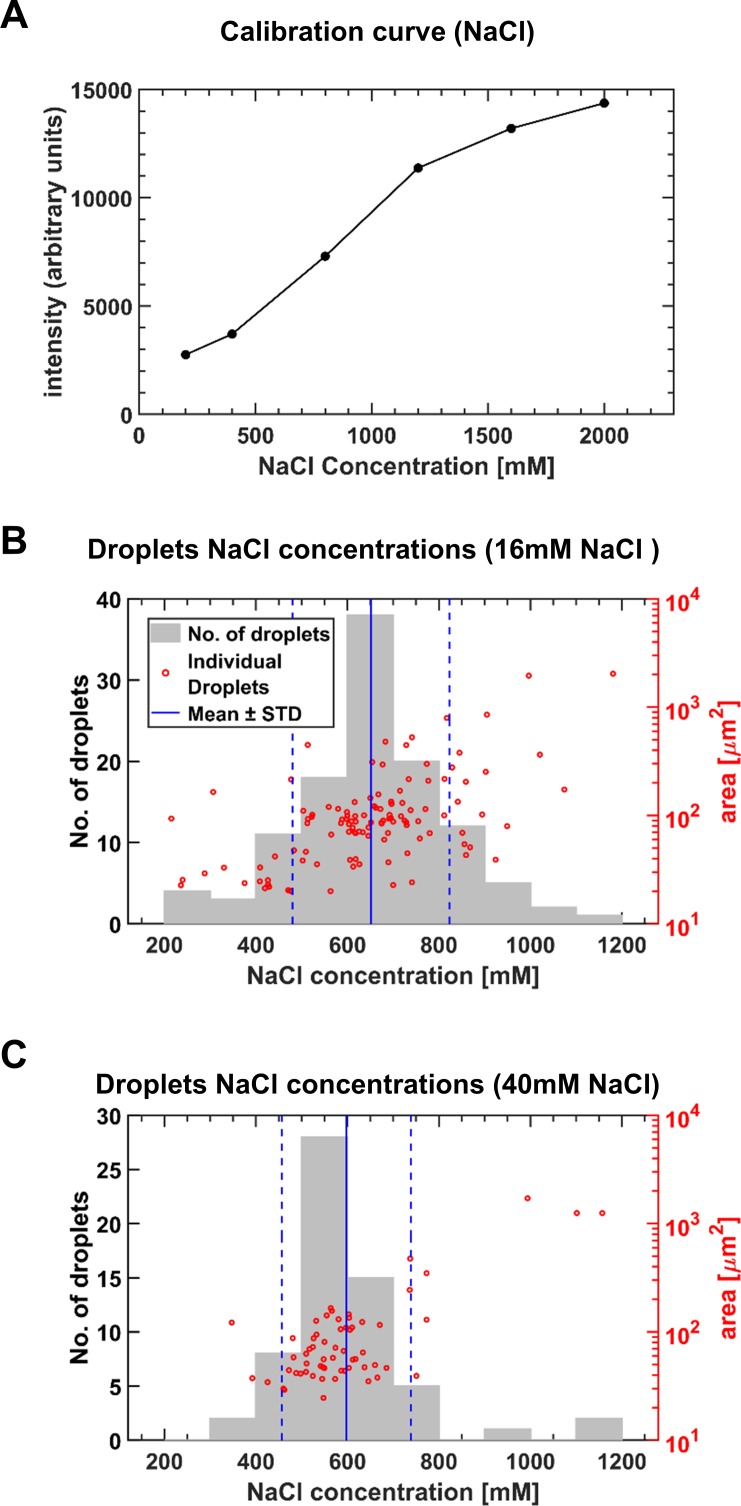
Figure 2—figure supplement 4. Estimating NaCl concentrations in microdroplets (medium containing diH2O + NaCl only).

Figure 2—figure supplement 4.

(A) In order to estimate the concentration of NaCl in the microdroplets, several drops of known NaCl concentrations were imaged by a confocal microscope, and their mean intensity was measured (see Materials and methods). The relationship between the drop concentration and fluorescence intensity constituted the calibration curve. (B–C) Microscopic droplet concentration factor was estimated by extracting the mean intensity of the microdroplets formed on a drying surface with beads, and interpolating the corresponding NaCl concentration. The concentration factor and area of the individual droplets are shown as red circles; the concentration factors histogram is shown in gray bars. (B) Initial NaCl medium concentration was 16 mM. NaCl concentrations in microdroplets was 650 ± 170 mM (Mean ± SD). Pearson correlation coefficient of microdroplet area and concentration was 0.47 (p-value<0.01). (C) Initial NaCl concentration was medium was 40 mM. NaCl concentrations in microdroplets was 600 ± 140 mM (Mean ± SD). Pearson correlation coefficient of microdroplet area and concentration is 0.8 (p-value<0.01). These results were in contrast to the lack of concentrations <>area correlations in experiments with M9. Further research is required to understand what factors determine these differences in correlations.
Figure 2—figure supplement 4—source data 1. NaCl calibration: relation between concentration [mM] vs intensity.
NaCl 16 mM, NaCl 40 mM: distribution of droplets' concentration (for corresponding initial concentration). Raw data: concentration [mM] vs area [um^2] for all droplets.
DOI: 10.7554/eLife.48508.010