. 2019 Oct 15;8:e48508. doi: 10.7554/eLife.48508

Figure 5. The interplay between self-organization, waterscape, and survival.

(A) Suggested conceptual model: The self-organization of cells on the surface affects the microscopic waterscape and the microscopic hydration conditions around cells, which in turn, together with cellular organization (i.e. aggregation) affects survival. (B) The three lines represent the fraction of the population residing above a given droplet size (i.e. the ratio between the area covered by cells residing in droplets larger than a given size, to the total area covered by cells) of the solitary (late-inoculation) experiment, the bead experiment, and the standard “aggregated “experiment on P. fluorescens. Inset: Aggregate-size distributions of these three experiments. Aggregation results in a larger fraction of the population ending up in large droplets with increased survival rates for cells therein.

Figure 5—source data 1. Figure 5B: Fraction of cells or beads(estimated by area) residing above a given droplet size.
The droplet sizes are 100 evenly spaced (logarithmic scale) values between 101.5 μm2 and maximal droplet size. Raw data: droplets area μm2] vs inhabiting aggregate area [μm2] for aggregated P. fluorescens, solitary P. fluorescens, beads Figure 5B inset: Aggregate area distribution. Distribution bins are 45 evenly spaced (logarithmic scale) values between 10−0.5 μm2 and 104 μm2.
DOI: 10.7554/eLife.48508.033

Figure 5.

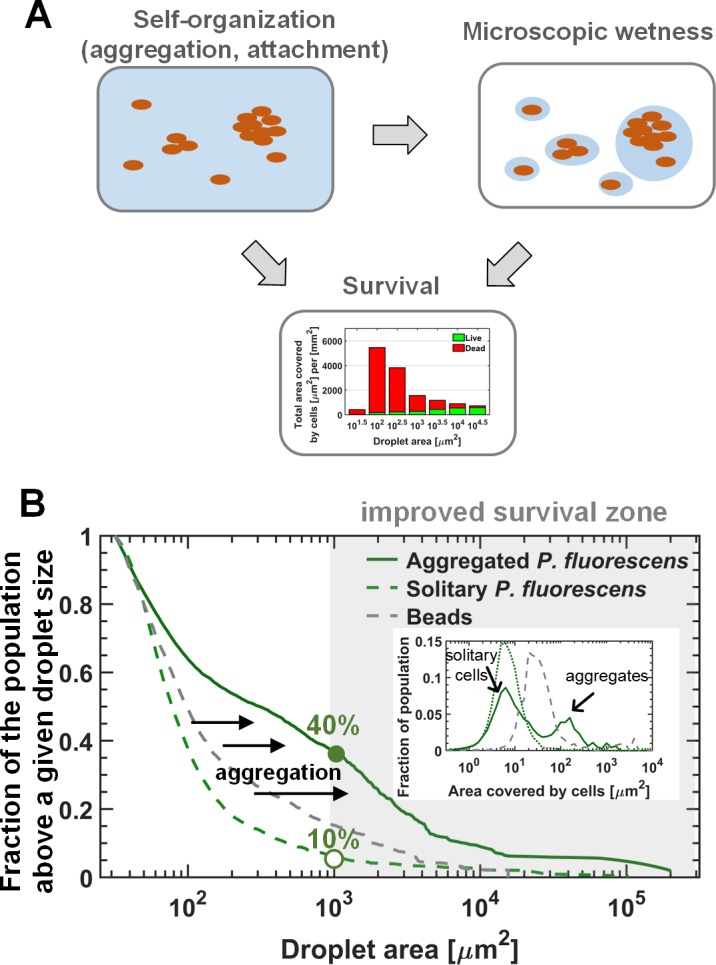
Figure 5—figure supplement 1. Aggregation and self-organization affect survival.

Figure 5—figure supplement 1.

(A) The cumulative cell abundance distribution residing above a given droplet size. (B) Aggregate-size distributions. In both (A) and (B), the bold lines represent combined data of all five surface sections (nine in case of the beads experiment), while the thin lines represent individual surface sections.
Figure 5—figure supplement 1—source data 1. Fraction of the population residing above a given droplet size.
Figure 5—figure supplement 1A: Area fraction of cells (or beads) residing above a given droplet size. The droplet sizes are 100 evenly spaced (logarithmic scale) values between 101.5 μm2 and maximal droplet size (collective for all groups). Raw data: droplet area [μm2] vs cell area [μm2] and 'repeat' represents different field of views (each field of view is represented by a thin line in the plot), for P. fluorescens, P. putida, beads. Figure 5—figure supplement 1B: Aggregate area distribution of cells and beads. Bins are 45 evenly spaced (logarithmic scale) values between 10−0.5 μm2 and 104 μm2 (collective for all groups). Raw data: aggregate area [μm2] , grouped by field of view ('repeat') for P. fluorescens, P. putida, beads.
DOI: 10.7554/eLife.48508.032