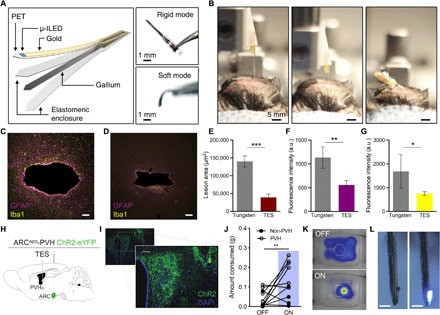
Fig. 5. Deep-tissue penetration with transformative electronics is better tolerated than rigid materials.

(A) Conceptual illustration of the fabrication scheme (left) and photographs (right) of the TES neural probe in rigid and soft modes. (B) Photographs of deep brain injection of the TES-based probe in rigid (left and center) and soft (right) modes. (C and D) Fluorescence images of 35-μm horizontal slices stained for astrocytes [glial fibrillary acidic protein (GFAP), purple] and activated microglia (Iba1, yellow) from tungsten (C) and TES (D) neural probes. Scale bars, 50 μm. (E to G) Cross sections through the tissue show reduced lesion area (E) and astrocytic (F) and microglial (G) responses from the TES compared to tungsten implants following 4 weeks of implantation (data are means ± SEM, n = 3 to 5 animals per implant; *P < 0.05, **P < 0.01, ***P < 0.001, unpaired two-tailed t test). a.u., arbitrary units. (H) Cartoon of optogenetic and TES device targeting strategy. (I) Fluorescent micrograph of PVH section showing ChR2-eYFP expression (green) and TES probe implantation site (yellow dashed outline). Scale bars, 10 μm. (J) One hour of 20-Hz photostimulation of ARCAgRP-PVH increases food consumption compared to 1 hour before stimulation [PVH: n = 6 mice, 4 AgRP-Cre × Ai32 and 2 AgRP-Cre with viral ChR2 transduction; non-PVH: n = 4; one-way analysis of variance (ANOVA) with Tukey’s multiple comparisons: PVH OFF versus PVH ON, **P < 0.01; non-PVH ON versus PVH OFF, **P < 0.01]. (K) Example heatmap of locomotor activity near the food container (hexagon) before (top) and during (bottom) photostimulation. (L) Photos of a functional TES neural probe retrieved 6 weeks after implantation. Scale bars, 500 μm. Photo credit: Sang-Hyuk Byun (A), Kyle E. Parker (I), Graydon B. Gereau (C and D), and Jordan G. McCall (B and L).
