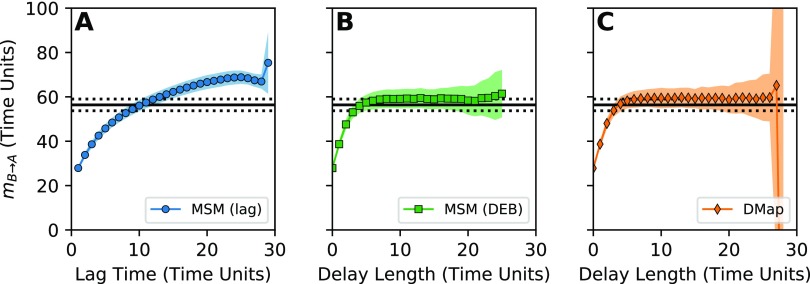
FIG. 4.
Comparison of methods for dealing with the projection error in an incomplete CV space. In all subplots, we estimate the mean first-passage time from state to state using a DGA scheme on only the y coordinate of the Müller-Brown potential. (a) Estimate constructed using an MSM basis with increasing lag time in (61), as a function of the lag time. (b) Estimate constructed using an MSM basis, but applying delay embedding rather than increasing the lag time, as a function of the delay length. (c) Estimate constructed using the diffusion-map basis with delay embedding, as a function of the delay length. In each plot, the symbols show the mean over 30 identically constructed trajectories, and the shading indicates the standard deviation across trajectories. The black solid line is an estimate of the mean first-passage time calculated using the reference scheme in the supplementary material, and the dashed error bars represent the standard deviation of the mean first-passage time over state B.

